While celebrating the fact that the U.S. economy has added back some jobs to pre-coronapanic levels, not bothering to adjust for the millions of additional folks who now occupy the United States, e.g., via immigration, the New York Times is forced to add the following:
In a substantial asterisk for the report’s broad strength, however, high demand has done little to expand the ranks of available workers by bringing people off the sidelines of the labor market.
And an accompanying chart shows that the trend of Americans sitting at home playing Xbox (back in stock!) is actually accelerating:

Does it make sense to look at these statistics on a nationwide basis? The level of coronapanic varied widely from state to state. The attractiveness of relaxing at home on welfare, compared to the spending power afforded by working full time at the median wage, also varies widely from state to state (CATO; see Table 4).
Let’s have a look at New York, where CATO found (2013) that the welfare lifestyle yielded 110 percent of the spending power of a median worker (St. Louis Fed):

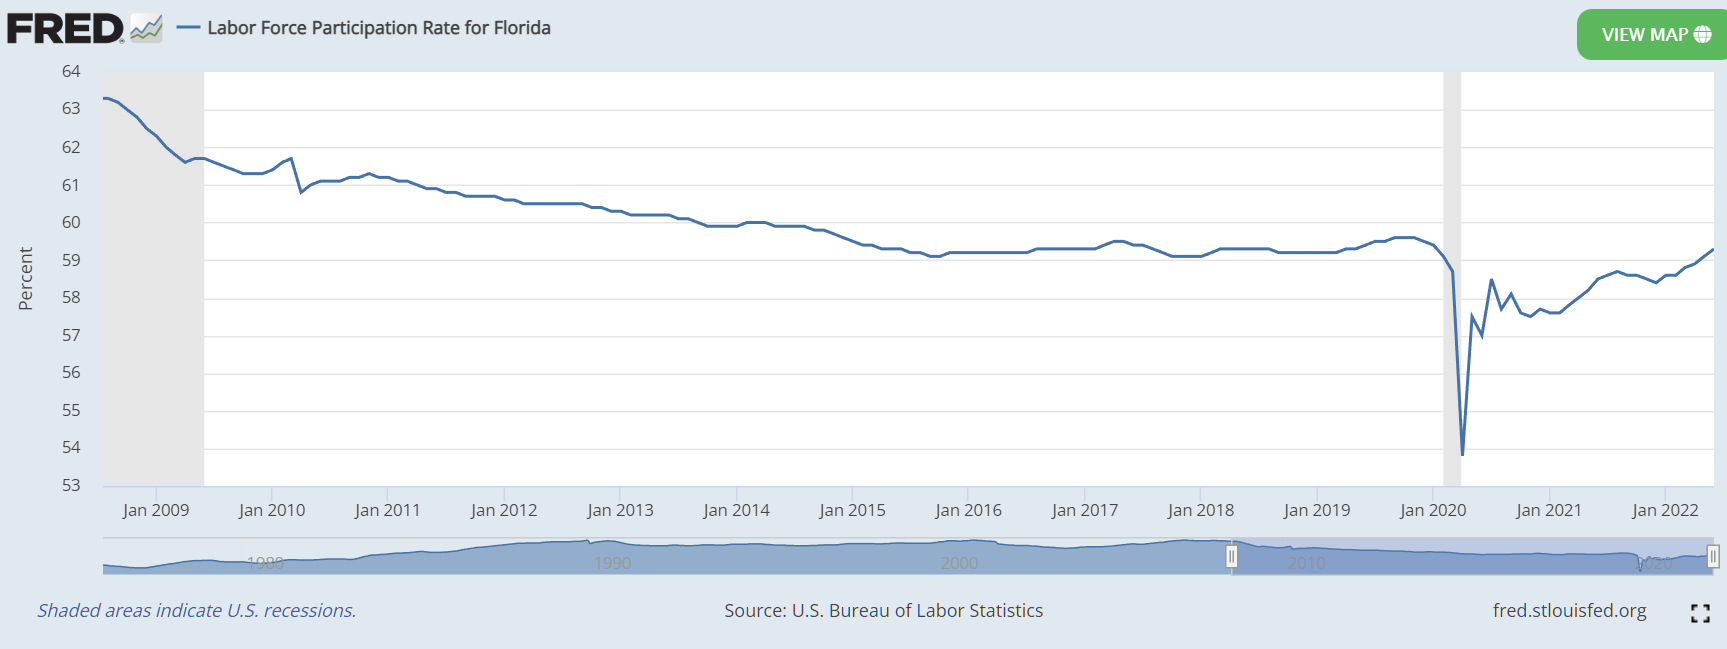
Still down a full percentage point compared to pre-coronapanic. With perhaps some exceptions for young attractive women, Science-following Governor Andrew Cuomo made it illegal for New Yorkers to work and they followed his instructions. What about in Florida, where relaxing on welfare was worth only 41 percent of the spending power of a median worker and where the tyrant Ron DeSantis allowed people to continue working? (source)
Related:
- “Bartleby, the Scrivener” (“I would prefer not to.”), who would have loved public housing, Medicaid, SNAP/EBT, Obamaphone, and taxpayer-funded at-home broadband
Don’t see much difference between FL & NY. They’re both blue states nowadays. The lion kingdom is so old & so used to the size government before 1990, it’s like we don’t exist in the current world. Our beliefs are too far right to ever count in any state.
Did you notice that labor participation is higher in NY than in FL? Both before the pandemic and after?
If NY welfare is such a sweet deal, and has been since 2013, then how would you explain that?
Also, with post-pandemic starting wages way up, why would welfare look even more attractive now?
* Did you look at these stats by age range?
David: The FRED data are for the standard definition of labor force participation, which I think includes anyone 16 or over. So any state with a lot of folks over 65 will have a lower labor force participation rate.
https://www.prb.org/resources/which-us-states-are-the-oldest/ shows that you’d expect Florida to have a lower participation rate than New York, even if Florida were not a retirement destination per se.
When people want to break it down by age they can, e.g., in
https://obamawhitehouse.archives.gov/sites/default/files/page/files/20160620_cea_primeage_male_lfp.pdf
Your separate question is “Why is welfare more attractive now?” If you were smart enough to get into means-tested public housing prior to Joe Biden taking office, you’ve been insulated from all of the inflation in rent prices. It is true that wages are up in nominal dollars, but they’re actually down in real dollars, even with the government’s fraudulent CPI statistic.
See https://www.bls.gov/news.release/realer.nr0.htm
“Real average weekly earnings decreased 1.0 percent over the month due to the change in real average hourly earnings combined with no change in the average workweek. Real average hourly earnings decreased 3.6 percent, seasonally adjusted, from June 2021 to June 2022. The change in real average hourly earnings combined with a decrease of 0.9 percent in the average workweek resulted in a 4.4-percent decrease in real average weekly earnings over this period.”
By contrast, the present U.S. welfare system compensates people in-kind. So the value of the benefits has a constant real value. The free apartment in Manhattan continues to be a free apartment in Manhattan regardless of what the wage slaves might be paying in rent for something in the same neighborhood.
Excuse the spammy website, but this shows some stats per sector:
https://www.mcall.com/business/mc-nws-pa-wage-increases-by-industry-20220812-tygta7ncj5ftdfyiszynsweatu-story.html
Wage increases have outpaced inflation in transportation, retail, and leisure and hospitality.
This largely matches what people are seeing. Costs are way up in restaurants and hotels, and low-skilled wages in these sectors are up.
For example, Chipotle in SF has posters on their doors offering starting wages in the 17-20/hour range.
These are the types of jobs that low-skilled people are going into. This is the better comparison.
If you’re a low-skilled worker doing nothing, there has never been a better time to move into the workforce than over the last 3-6 months.
David: There were a bunch of new welfare programs introduced with coronapanic. Once people experience the miracle of a lifestyle funded by someone else, it is tough to get them back to work. See https://www.wsj.com/articles/the-high-cost-of-free-money-harvard-exeter-study-stimulus-handout-low-income-well-being-health-personal-agency-poverty-covid-11658166372 for example. Maybe I should do a separate blog post on this one.
During a randomized trial conducted from July 2020 to May 2021, researchers assigned 2,073 low-income participants to receive a one-time unconditional cash transfer of either $500 or $2,000. Another 3,170 people with similar financial, demographic and socioeconomic characteristics served as a control group. The trial was funded by an anonymous nonprofit. Participants earned an average of about $950 a month and had $530 in unearned income (e.g., food stamps). About 80% had children, and 55% were unemployed. Over 15 weeks they were surveyed about their physical, mental and financial well-being. Forty-three percent also agreed to allow researchers to observe their bank balances and financial transactions. Handout recipients fared worse on most survey outcomes. They reported less earned income and liquidity, lower work performance and satisfaction, more financial stress, sleep quality and physical health, and higher levels of loneliness and anxiety than the control group. There was no difference between the two cash groups.
I’m not disagreeing that cash payments reduce work incentives.
I believe most of those ended around Sept of last year.
Which states are giving out enhanced covid-related benefits mid-2022?
David: I think you’re overlooking that actual humans are not homo economicus and also that leisure time has a value. It may not make sense to rush back to work merely because hourly pay has been boosted slightly, depending on your value of leisure time. People were introduced to a whole new world of leisure in 2020 and 2021 and, therefore, their perspective on the value of being free to do whatever they want whenever they want may have changed. See https://philip.greenspun.com/blog/2016/11/30/long-term-effects-of-short-term-free-cash-guaranteed-minimum-income-experiments/ for how a short-term guaranteed income program resulted in a long term withdrawal from the tedious world of work.
Male labor participation has dropped steadily since 1970:
https://www.richmondfed.org/publications/research/econ_focus/2021/q1/district_digest
Why would a male, especially the deplorable white heterosexual sort, work? Imagine that there were still laptop manufacturers in the U.S. The Deplorable would dutifully assemble the product for the laptop class, whose members would then use the product to denounce him as a racist, bigot and patriarch.
All while the Deplorable is working for a fifth of the laptop class’ salary and giving half of it to his ex wife (who also calls him a patriarch).
I think the lockdowns caused some people reflect on their lives; I’m surprised that participation dropped relatively little.
Being a New Englander, I paged through the FRED graphs for those states. You may want to check my math, but here’s what I’m seeing for the percentage-point change in seasonally-adjusted labor force rates between 12/2019 and 6/2022:
VT: -5.1
ME: -3.5
NH: -2.8
CT: -2.6
RI: -0.9
MA: -0.3
I would not have expected NH to look so much like VT, ME, and CT by this measure. I especially would not have expected MA to have the smallest rate change. I have no Grand Unified Coronapanic Theory that explains this.
Thanks for the research, Paul. I think MA may have done well because no state has a higher percentage of members of the laptop class, which took care of itself quite nicely since 2020. Biotech, health care, higher education, government workers, etc. were all protected from the economic vicissitudes of 2020-2021.