I found my mom’s Melrose High School Class of 1951 25th reunion newsletter and scanned it. The high school today is ranked #1,568 in the nation (among public high schools) and #60 in Maskachusetts.
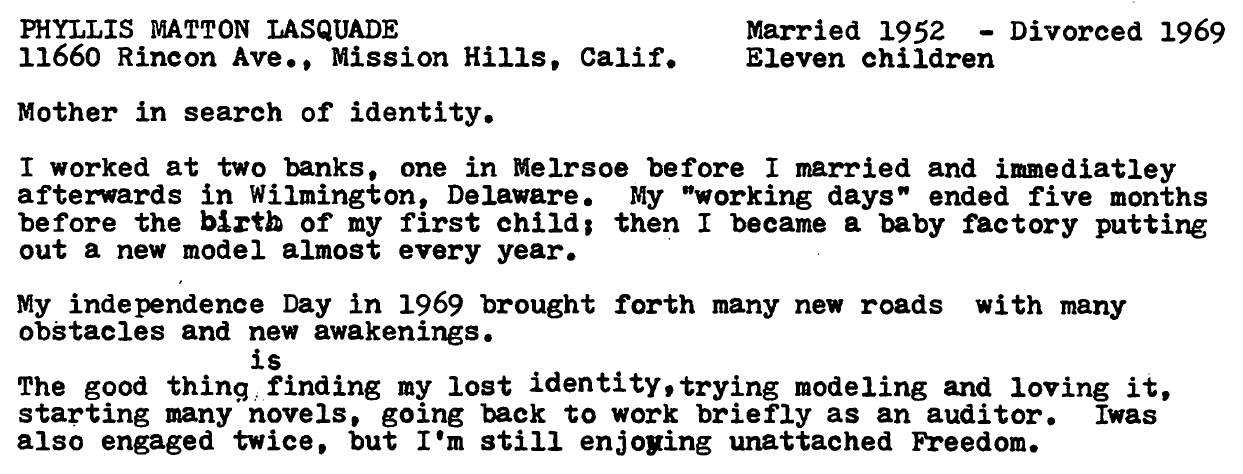
My favorite excerpt from what is presumably a 1976 document is “then I became a baby factory putting out a new model almost every year”:
It looks like nearly everyone who wanted to go to what are today considered elite colleges managed to get in. The former high schoolers talk about graduating from University of California, Cornell, Colby, Bates, Boston University, Tufts, University of Michigan, Harvard, Caltech, MIT, Dartmouth, Amherst, etc.
Here’s something interesting… the document is so old that a white male could be hired as head of what we now call “HR”:
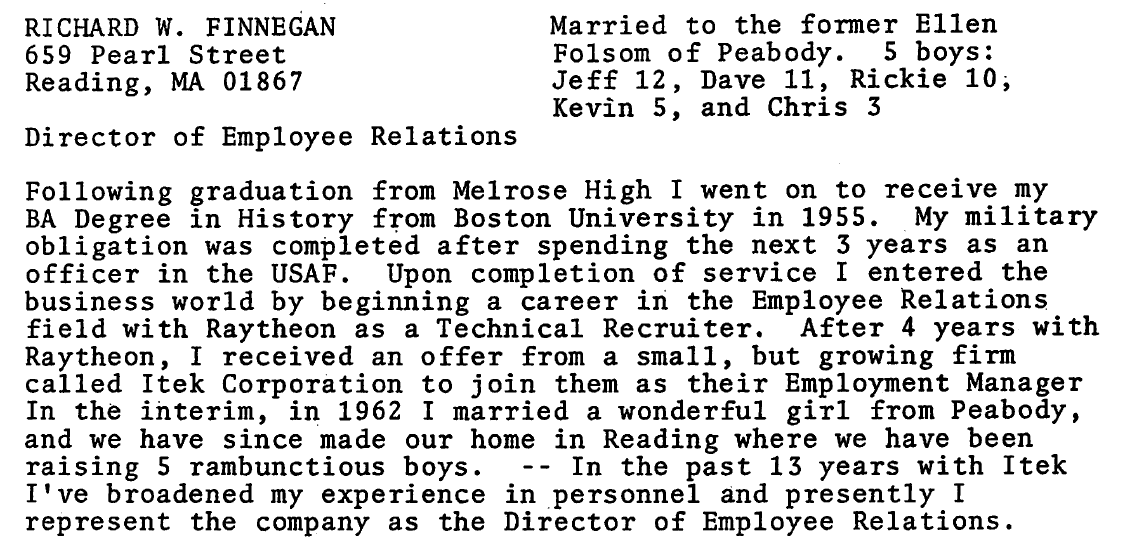
(Boston University today rejects 9 out of 10 applicants.)
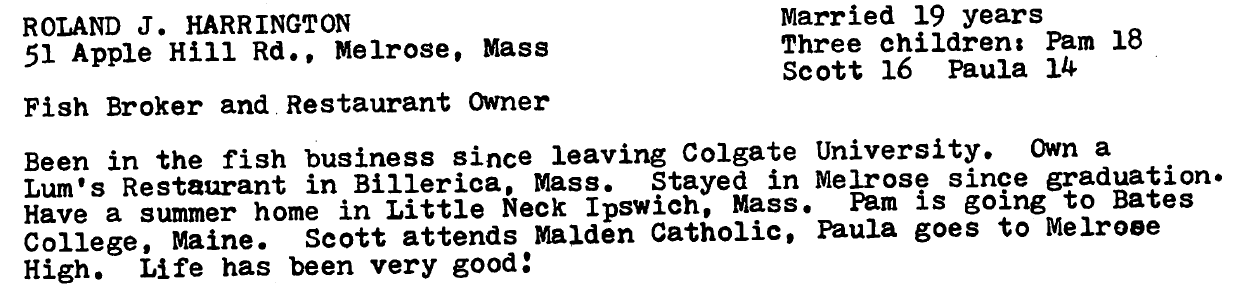
Here’s a guy who went from Colgate University (rejects 7 out of 8 applicants today; cost to attend approximately $360,000) to selling fish. The daughter went to Bates, which is today similarly selective to Colgate.
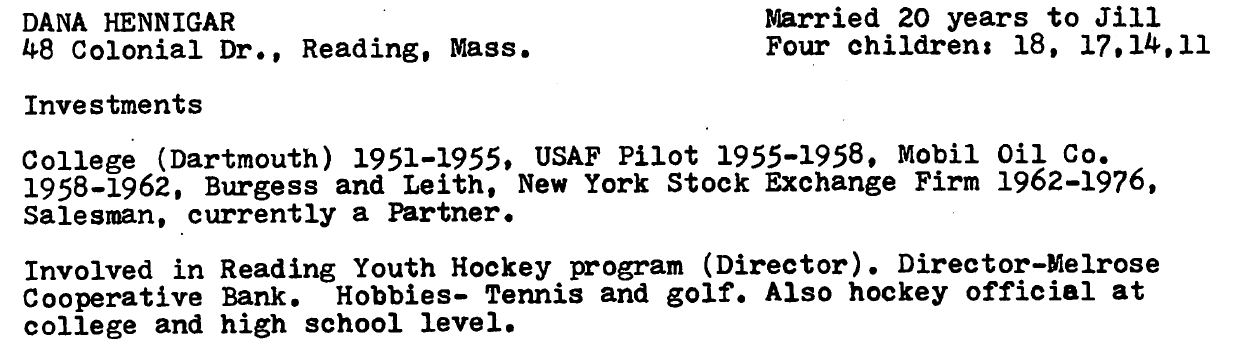
Dartmouth today rejects 15 out of 16 applicants, but plenty of Melrose High ’51 grads got in:
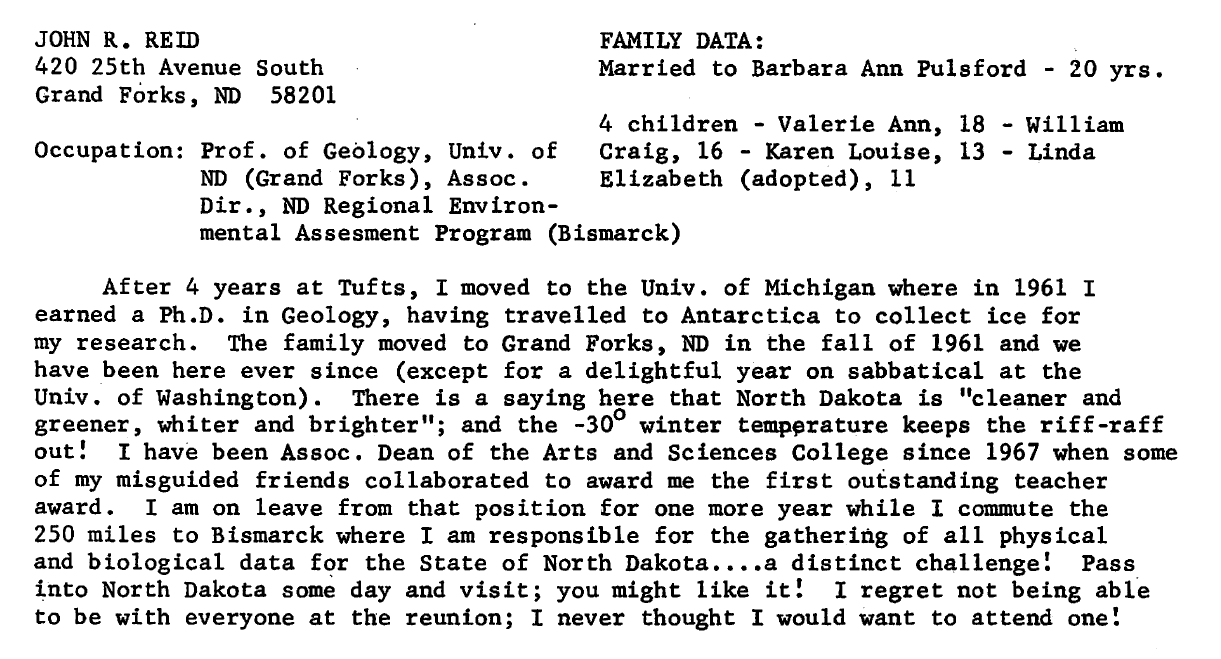
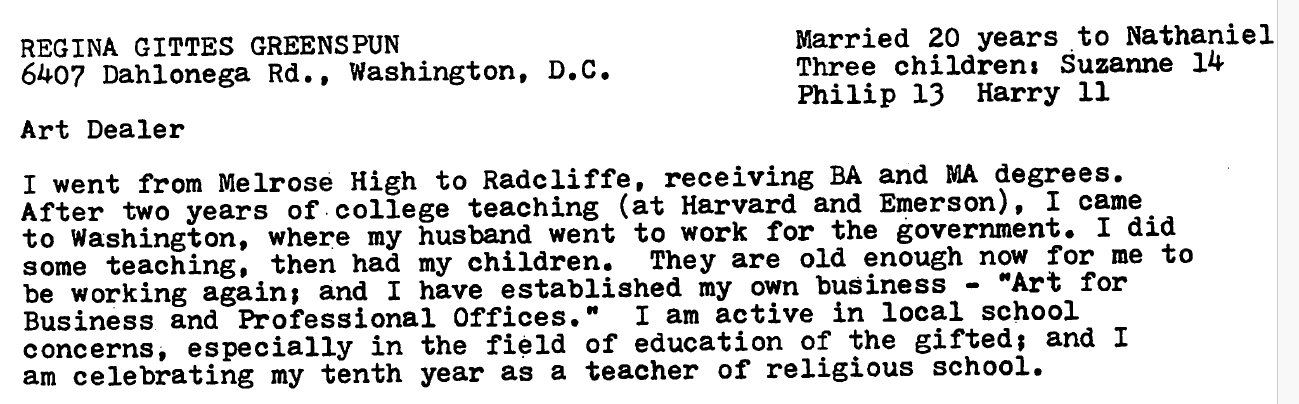
Here’s a guy who seems to have gotten married just as he was graduating from Tufts (rejects 9 out of 10 applicants) and the wife of 20 years had to follow him first to Michigan and then to North Dakota:
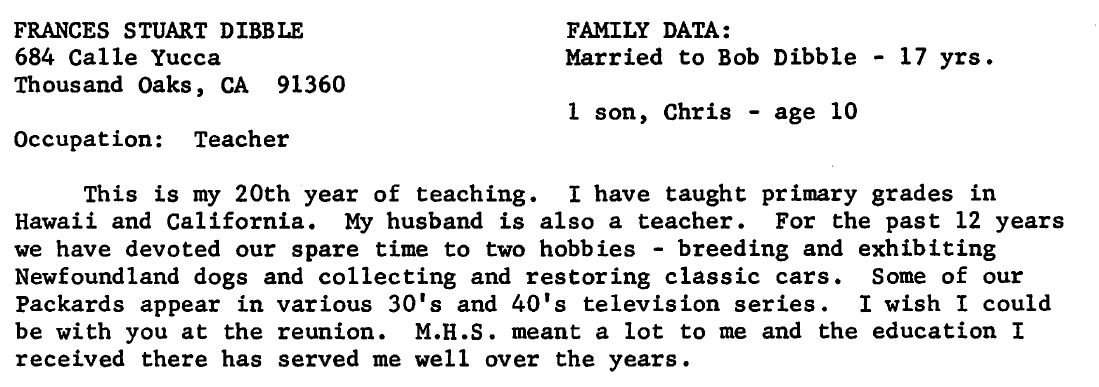
The graduates who were most passionate about dogs had the fewest children:
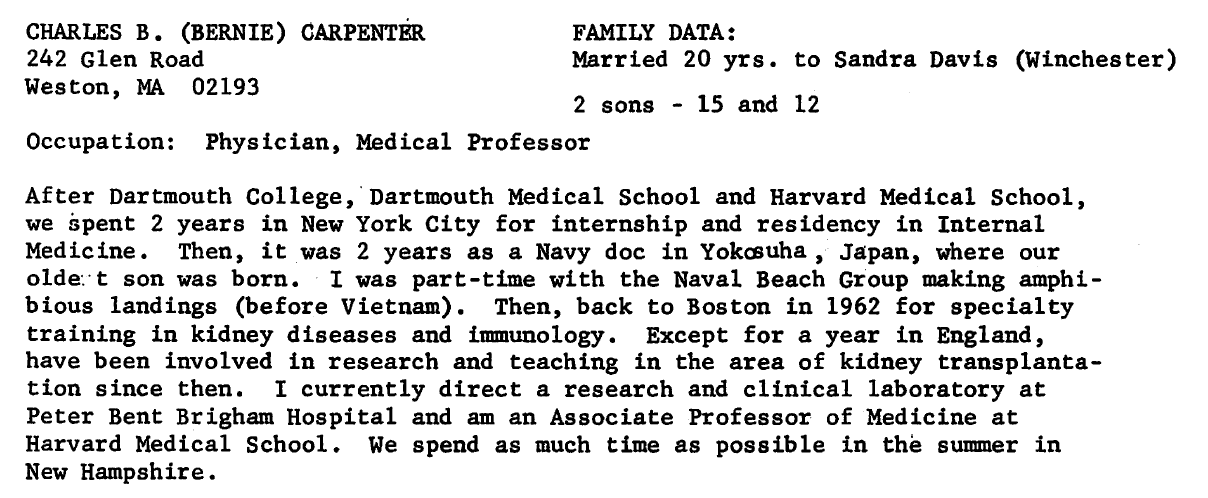
Here’s a guy who achieved what today would be a moonshot:
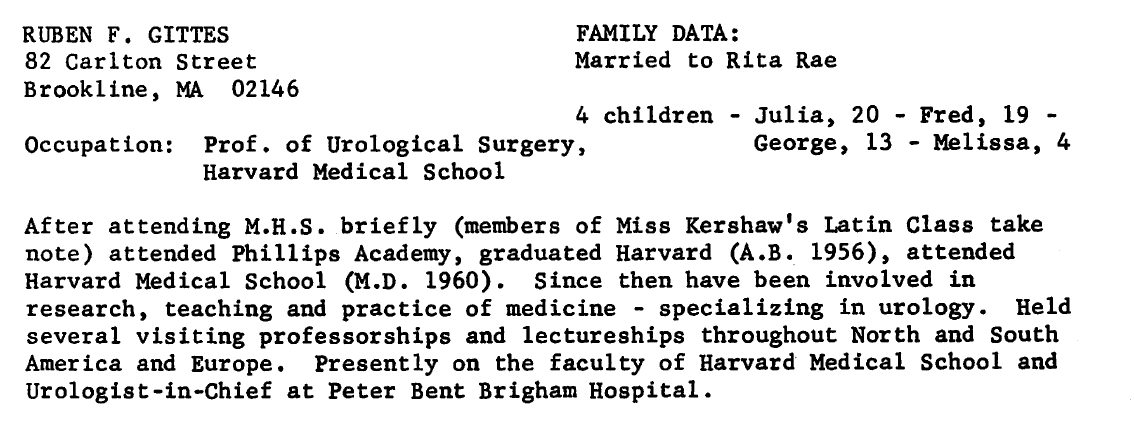
My mother’s first cousin Ruben Gittes, another moonshot achiever by today’s standards:
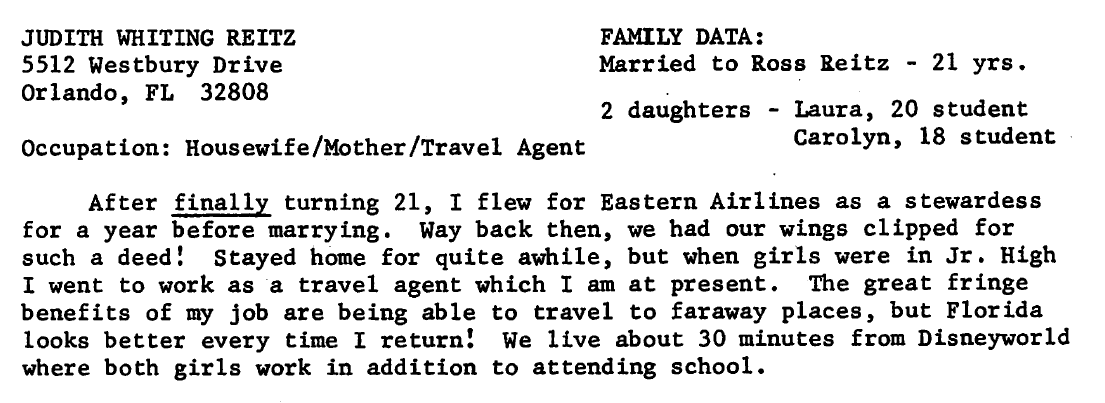
She moved to Orlando and loved it:
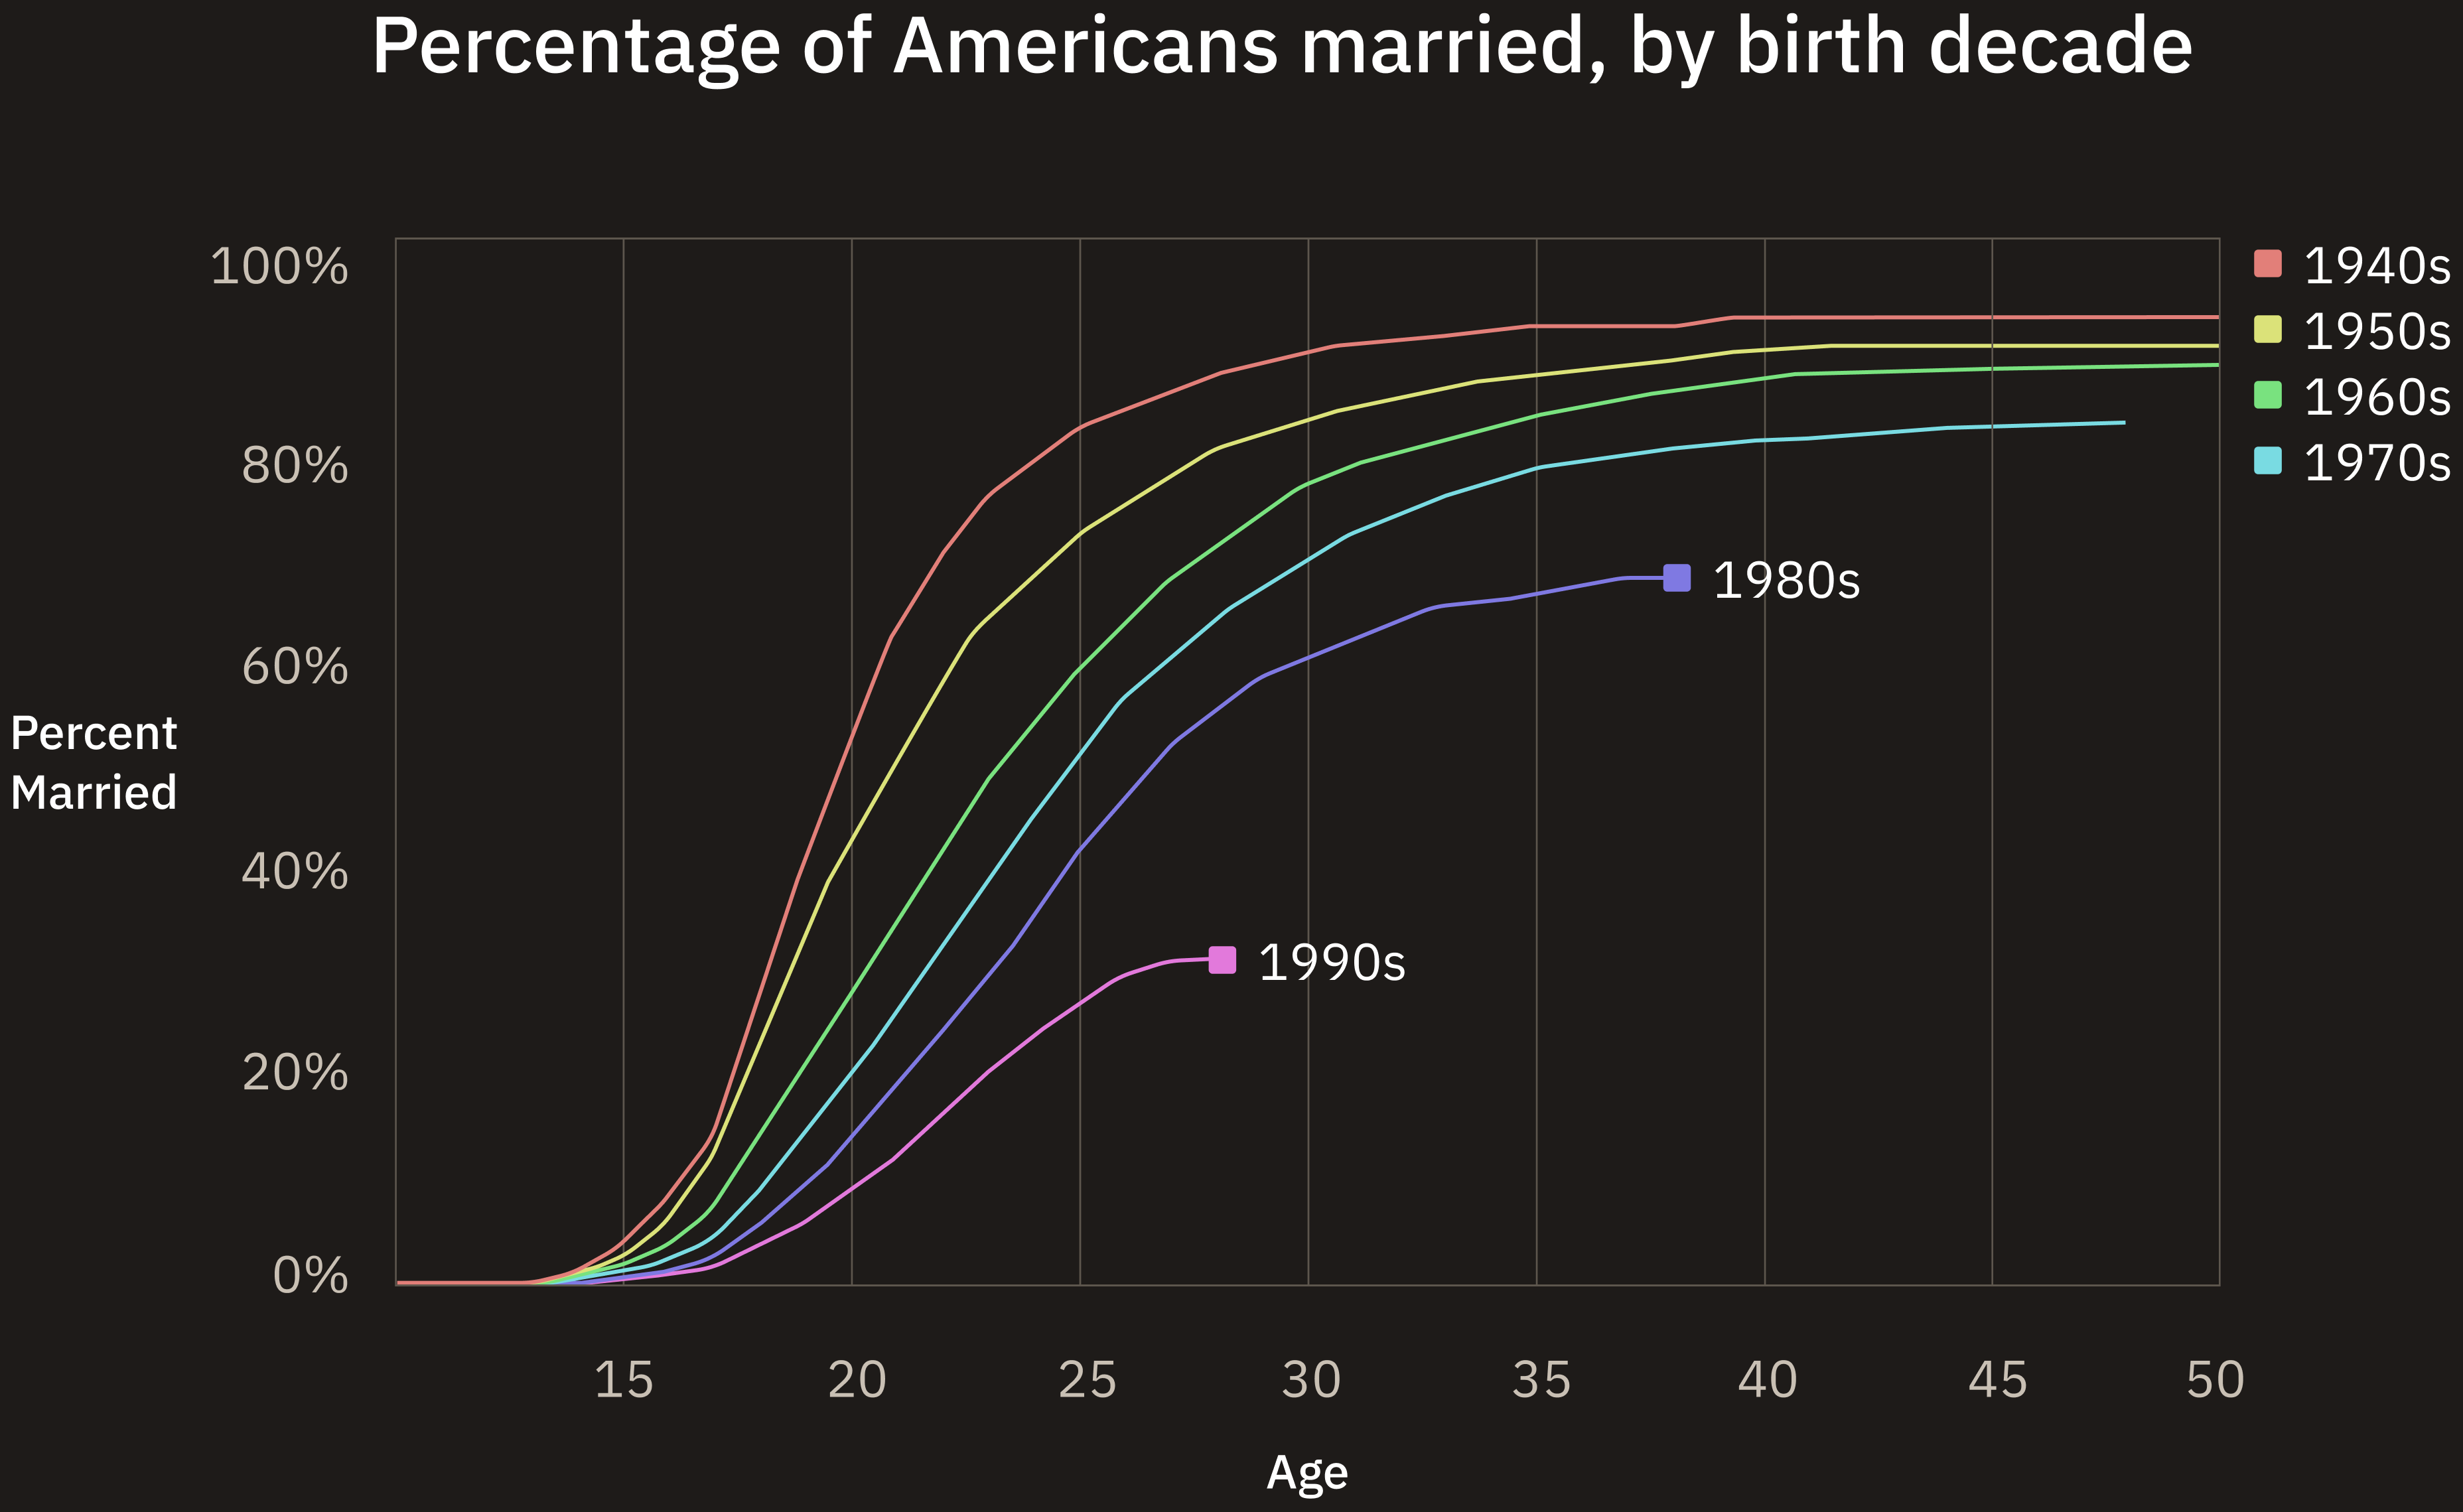
My take-aways… people were generally married within 4 years of finishing high school. The divorce rate among this high school class was about 10 percent. These folks were born in the 1930s so they didn’t quite make it into this chart (from “Human Reproduction as Prisoner’s Dilemma”), but it looks as though we’d expect roughly 90 percent to be married at a 25th high school reunion:
A brilliant-by-today’s-standards career was apparently achievable for the Melrose ’51 cohort simply by showing up. Not only did these graduates have no immigrants to compete with, but the pay-to-cost-of-living ratio was sufficiently high that a lot of smart well-educated women withdrew from the labor force, thus leaving the field open to others. Example:
Nobody reports having joined the 2SLGBTQQIA+ community. The editor’s introduction does not mention anyone having changed names except for female graduates (a defined term back then) who got married: “We have tried to make an accounting of the entire class. People are arranged alphabetically (girls by maiden name).”
How about my mom’s report?
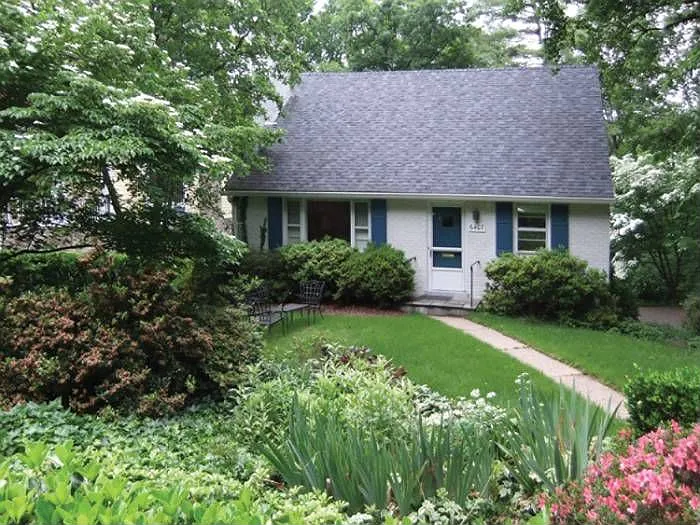
Zillow still shows the crummy 1953 Cape Cod house in which we grew up (address above) and lists the mansion’s 1,603 square feet of space (we also used the basement, though, and a screen porch that was glassed in and maybe isn’t included). However, it was bulldozed within hours of being sold in 2012 and the Indian immigrants who purchased it built a McMansion in its place.
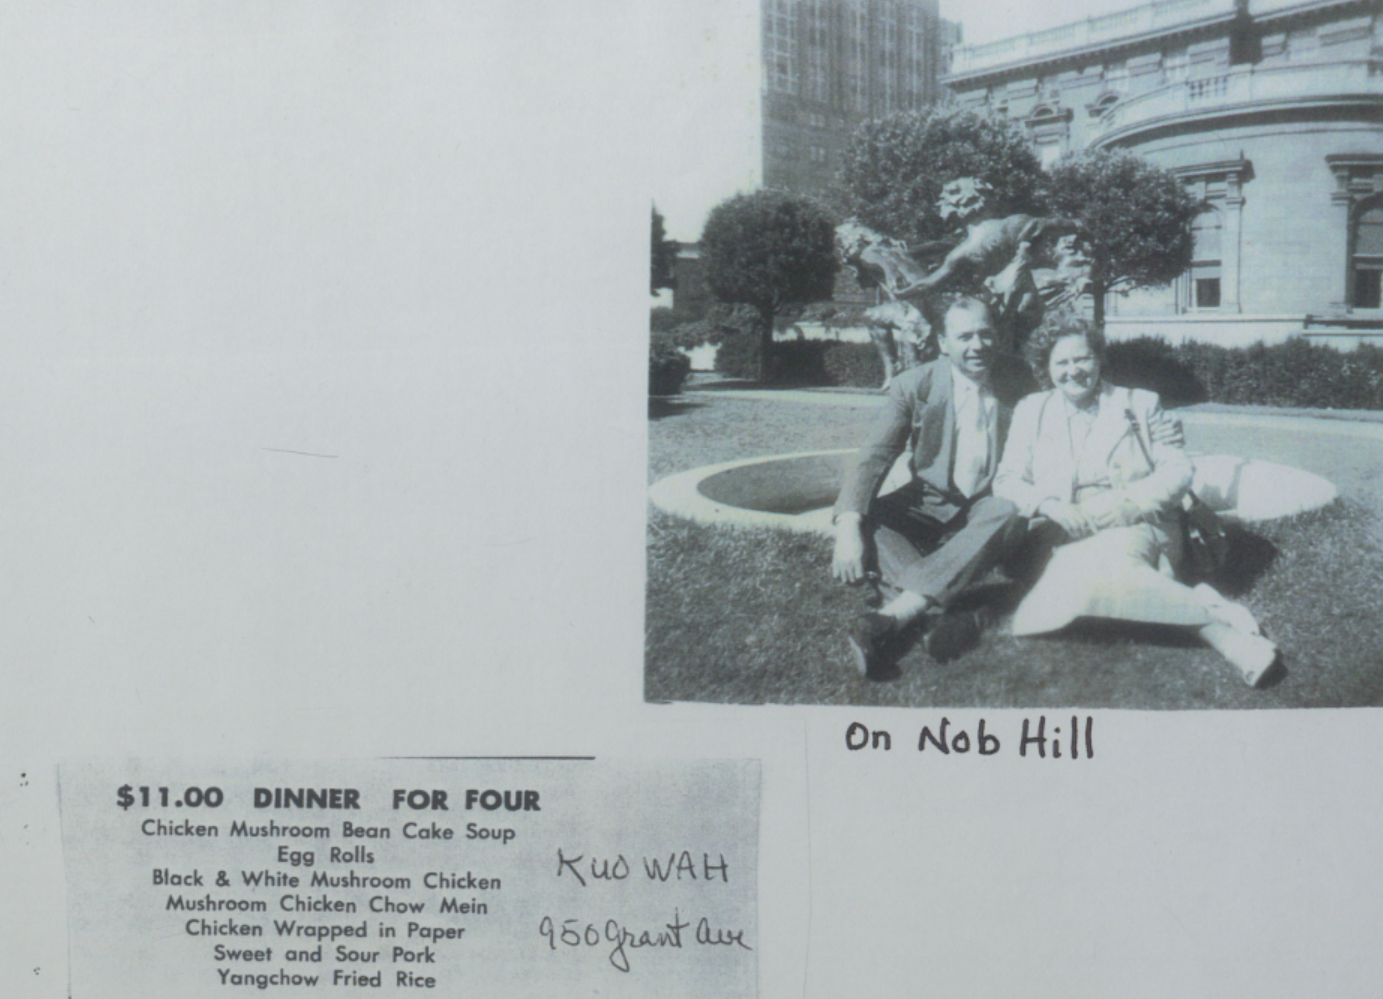
What were prices like back then? I scanned mom’s 1951 cross-country family trip album. A Chinese dinner for four in San Francisco was $11:
Raytheon Co. in Bedford, MA put bread on the table for four generations of my family. My father earned his Engineering degree at night while working as a Draftsman. My grandmother was still collecting her deceased husband’s Raytheon pension check right up until her death in 2010 – thirty-five years after my grandfather’s death.
We already had a 30th reunion but never had any printed biographies, let alone what would have required a type writer & expensive document reproduction in those days. The output per worker was much less in those days. Duplicating a document, creating a mechanical model, looking up how to implement a 2nd order highpass filter is nothing now. Perhaps automation has shifted the wealth from the working masses to the few. My high school is now ranked 443 nationally. Maybe blog commenting is a moonshot.
You are overestimating the cost of a mimeograph
The BLS CPI inflation calculator tells us that $11 in 1951 dollars is worth $137.57 of today’s dollars.
Kuo Wah no longer exists at 950 Grant Ave, but New Woey Loy Goey Restaurant on the same block has an online family dinner for 4 priced at $88, with no obvious cuts to the contents of the meal. If anything we should assume that the portion size has increased to satisfy demands of the larger-than-FAA-standard American appetite.
Is Chinatown somehow inflation-resistant? The BLS would have us believe that there’s an annualized 3.47% inflation over that 74 year period, but this place has it down to a 2.85% average. Forget about BTC – what I really need is for the SEC to open up Szechuan Chicken ETFs in my 401(k).
Curious about your comment: “Not only did these graduates have no immigrants to compete with…” I thought this country was defined by successive waves of immigrants: Germans, Poles, Italians, Puerto Ricans, etc. My own family came over in the post-WWII wave of European refugees. If there was no immigration in the 50s, then when did immigration stop, and when did it start up again?
She: The U.S. mostly closed its borders in the early 1920s and the foreign-born share of the population reached a low in 1965 (we’re now likely at about 4X the percentage of immigrants compared to then, but nobody can say for sure since we don’t have any reliable way of estimating the noble undocumented).
https://www.pewresearch.org/race-and-ethnicity/2015/09/28/modern-immigration-wave-brings-59-million-to-u-s-driving-population-growth-and-change-through-2065/
has a chart of foreign-born percentage 1850-2015. There is no “post-WWII wave”.
https://history.state.gov/milestones/1921-1936/immigration-act
talks about the 1924 immigration act that excluded Asians and limited by quota those from Europe. “In all of its parts, the most basic purpose of the 1924 Immigration Act was to preserve the ideal of U.S. homogeneity.”
See also https://www.migrationpolicy.org/article/1924-us-immigration-act-history
https://www.nytimes.com/2024/12/11/briefing/us-immigration-surge.html also has some charts. It says that we’re currently at “A new high for the U.S. foreign-born population” and shows that the share of foreign-born within the U.S. declined steadily between 1920 and 1965. There was no “post-WWII wave”.
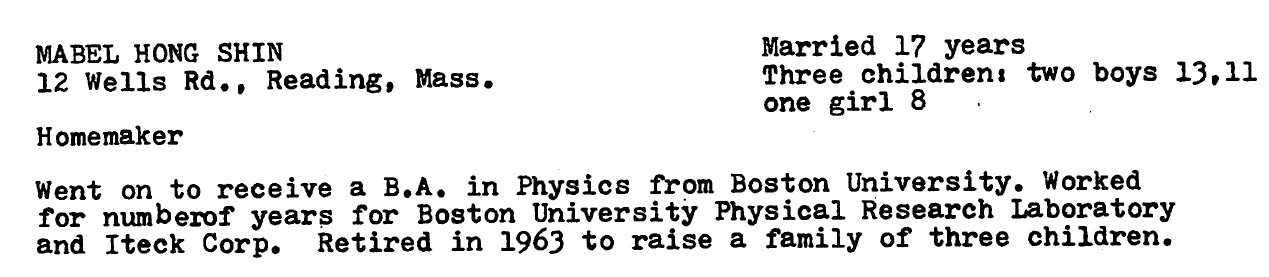
You don’t think Mabel Hong Shin was an immigrant?
SN: If Mabel Hong Shin was Asian it would have been illegal for her to immigrate to the U.S. Only in 1965 were the 1920s prohibitions on Asians rescinded (see https://en.wikipedia.org/wiki/Immigration_and_Nationality_Act_of_1965 ).
I went through Ivy School collages info, and it appears then in 150th – early 1960th admissions were rapidly expanding. Still, freshman class was about 700 to 900 in 1955- 1960. Which means that colleges were easier to get into due to fewer people applying, even adjusted for smaller overall population.
Which is due to US having real economy back than that put premium on real skills vs college degree.
Now, facts that 1) due to loosing manufacturing and with it research and design American society was directed from at least mid 1990th to create fake opportunities in fake arts and sciences instead of real productive fields due to the latest being all outsourced, 2) supported by Supreme Court decision that established that promotion on skill over a college degree to be discriminatory, created college – governmental – media – Democrat party complex which president Eisenhower forgot to warn us about. However, it is not clear why Ivy League schools do not expand admissions as they did in 1950th to indoctrinate more youngsters in arts of Marxism, DEI and LGTBQA++–. Maybe their admissions folks just lost their quantitative skills somewhere along the way, or are in the process of dreaming big dreams, enhanced by legal marijuana. To be fair, when you are swamped by million of admission applications written by chat GPT or paid tutors, it is hard to figure out who is a real victim worthy of admission and who is pretending.
However, recalling my pre – historic (pre – DEI) training in frequentist probability and binomial distribution, if a young victim with the right essay applies to 10 collages which accept 1 in 10, xzer chances of acceptance to at least one of them is about 65%
perplexed: Thanks for calculating the probability (0.9^10 is the probability of being rejected by all 10 if these are random trials), but given the groupthink among American progressives I don’t think that it is fair to assume random uncorrelated trials. A white applicant who says “I am cisgender heterosexual and supported Donald Trump 2024” is not going to be accepted to any elite school.
Philip, I think that one ” applicant who says “I am cisgender heterosexual and supported Donald Trump 2024”” is going to be accepted as a token conservative to Harvard, at least for the role of a punching bag. But why would Chat GPT or paid admission advisors write this for any applicant? My assumption of independence of each admission review is valid only for applicants with “right essay”.. “right” means that essay explores how the applicant, who self-identifies as a member of right group, let’s say indigenous queer for palestine (something like this has been working for Sen Warren in MA), fought for acceptance in cis-gendered male Trump voter – dominated world of deep – blue states. Why would someone who publicly identifies as a Trump voter would want to go to Harvard?
If you’re using US News, the rankings are nonsensical: https://www.usnews.com/education/best-high-schools/national-rankings
No school in NY scores above #25, including Stuyvesant, Bronx High School of Science (#36), etc. Thomas Jefferson High School scores at #14.
I have never heard of their top 5, and doubt many people think the student population of Peoria competes with top percentile students in NY or CA.
This indicates to me that their ratings are likely unpredictive of things like academic awards, lifetime earnings, etc.
https://www.usnews.com/education/best-high-schools/articles/how-us-news-calculated-the-rankings lays out the factors. Here are some:
proportion of a school’s 12th graders who took and earned a qualifying score on Advanced Placement (AP) or International Baccalaureate (IB) exams
The College Curriculum Breadth Index, or CCBI, is calculated among a school’s 2021-2022 12th graders from the percentage who took, and the percentage who earned qualifying scores on, multiple AP or IB exams.
[State assessments both “proficiency” and “performance”, which I can’t figure out how they’re different. This is 20% of the ranking and it looks like they are giving credit if the school contains a lot of students for whom progressive Democrats have low expectations: “In all 50 states, there is a very significant statistical relationship between the proportion of a student body that is Black, Hispanic and/or from a low-income household – defined as being eligible for free or subsidized school lunch – and a school’s results on state assessments. Schools performing best on this ranking indicator are those whose assessment scores far exceeded U.S. News’ modeled expectations.”]
Underserved Student Performance (10%) This is a measure assessing learning outcomes only among Black, Hispanic and low-income students. This evaluates how well this underserved subgroup scored on state assessments compared with the average for nonunderserved students among schools in the same state.
John: So up to 30% of the ranking is based on sorting students by skin color, a cherished activity for bureaucratic and journalistic elites.