Previously from the U.K.:
- March 16: unless you retreat into a cave, you’re going to die at some point over the next two years (Imperial College epidemiologists predict a best case of 250,000 deaths in Great Britain without extreme economic/societal shutdowns)
- March 24: if you were going to die, you are quite likely already dead (Oxford epidemiologists think a significant percentage of UK residents are already infected)
Yesterday: “UK has enough intensive care units for coronavirus, expert predicts” (New Scientist)
[the expert[ said that expected increases in National Health Service capacity and ongoing restrictions to people’s movements make him “reasonably confident” the health service can cope when the predicted peak of the epidemic arrives in two or three weeks. UK deaths from the disease are now unlikely to exceed 20,000, he said, and could be much lower.
New data from the rest of Europe suggests that the outbreak is running faster than expected, said [expert]. As a result, epidemiologists have revised their estimate of the reproduction number (R0) of the virus. This measure of how many other people a carrier usually infects is now believed to be just over three, he said, up from 2.5. “That adds more evidence to support the more intensive social distancing measures,” he said.
Who is this “expert” telling the Brits to chill out? Neil Ferguson, the lead author of the March 16 Imperial College paper that told the British to freak out.
(Professor Ferguson doesn’t explicitly say “my Oxford competitors are right and I was wrong”, but upping R0 to “just over three” supports the Oxford theory. Let’s assume “just over 3” is about 3.4. He previously was thinking 2.5. How do these compare? If we just do the simple exponential and don’t bother to consider people meeting the already-infected, after 8 exchanges of germs, the disease has spread 12X more widely under this quietly buried tweak. That’s the difference between 5% of the population and 60% that are infected and, by inference (since 60% of Britons aren’t dead), a huge difference in the lethality of COVID-19.)
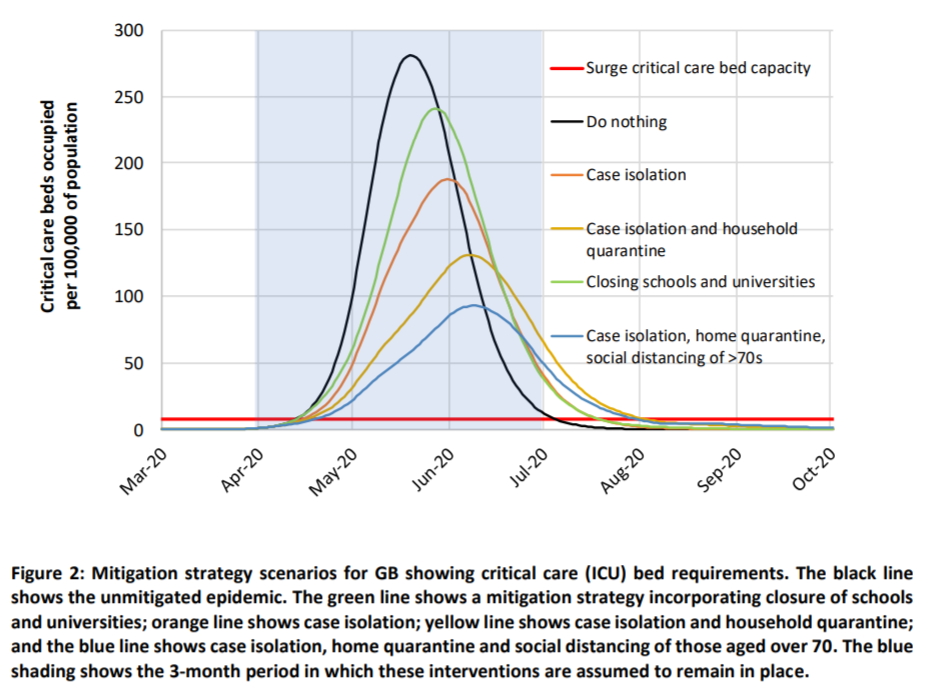
How about the peak? The Imperial College model has a chart showing mid-May, without mitigation attempts and June with even the most basic actions, such as isolating sick people. Most of the Britons who need “critical care” won’t be able to get it.
Now it seems that the peak will arrive in “two or three weeks,” i.e., no later than Easter(!) and, as noted above, nearly everyone who needs critical care will get it (but, unfortunately, 20,000 will still die).
The text of the March 16 paper is just as inconsistent with the latest statement as the graphs. On page 16 of that paper, he says that “even if all patients were able to be treated, we predict there would still be in the order of 250,000 deaths in GB”. So in a perfect world where the UK never ran out of critical care capacity and therefore every patient had access to all useful medical interventions, 250,000 would die just in Great Britain (not including Northern Ireland). He is saying now that, in an imperfect world where the hospitals are hanging on the hairy edge of figuring it out, 20,000 will die in the entire UK (including Northern Ireland). [see comments below for some discussion]
‘I am surprised that there has been such unqualified acceptance of the Imperial model,’ Professor Gupta [of Oxford] told the Financial Times.
Perhaps Imperial College professors don’t accept the Imperial model!
(And what does 20,000 deaths actually mean? Are they people who would have lived another 50 years in great health? Or mostly people who would have died within a year or two from an underlying condition?)
What does this mean for the U.S.? Unclear. The “chill out” opinion assumes a competently run health care system that already has policies in place for rationing care (i.e., super old/sick people that were in the ICU in the U.S. in 2019 would have been unplugged and buried in the U.K.). “In the UK’s health system, rationing isn’t a dirty word” says that the U.K. won’t spend more than $40,000 to keep someone alive for another year in good health. That’s the cost of a handful of ED visits here in the U.S., without even being admitted! If we used U.K. standards, half of the older people who are admitted to a hospital would be given three ibuprofen and sent home in an Uber Comfort.
[March 28, 2020 update, from “As the rest of Europe lives under lockdown, Sweden keeps calm and carries on” (Guardian):
Anders Tegnell, Sweden’s state epidemiologist, believes it is counterproductive to bring in the tightest restrictions at too early a stage. … His team at the Public Health Agency of Sweden is critical of the Imperial College paper that warned this month that 250,000 people in the UK would die if the government failed to introduce more draconian measures. A week later Johnson ordered the police to implement a partial lockdown to combat the virus, telling people they “must stay at home”.
“We have had a fair amount of people looking at it and they are sceptical,” says Tegnell. “They think Imperial chose a number of variables that gave a prognosis that was quite pessimistic, and that you could just as easily have chosen other variables that gave you another outcome. It’s not a peer-reviewed paper. It might be right, but it might also be terribly wrong. In Sweden, we are a bit surprised that it’s had such an impact.”
]
Philip, this seems like an extreme misreading. Ferguson isn’t saying “chill out,” he’s saying “this is why we’re on lockdown.” The chart that you included covers the non-lockdown (“mitigation”) measures. He’s describing the lockdown (“suppression”) scenario, shown in a second chart.
You know that the UK is now on lockdown, right?
Figure 3, “suppression strategy scenarios”, from the March 16 Ferguson, et al., paper shows more or less the same overwhelming peak, just a bit later.
The U.K. is locked down? https://www.theguardian.com/world/2020/mar/25/uk-coronavirus-lockdown-rules-what-you-can-and-cannot-do says people can rent a car, go to the park, meet a new friend, go to the friend’s house, have sex, pick up some dry cleaning, buy some supplies for a home repair at a hardware store, pick up some booze at the liquor store, go to the laundromat (which they can’t even spell right!), meet another new friend, go to that person’s house, have sex, and finally return the rental car to be vacuumed out by someone not wearing a mask.
https://www.reuters.com/article/us-health-coronavirus-dating/love-in-the-time-of-coronavirus-around-the-world-dating-finds-a-way-idUSKBN2161U6
says “locked down” people are still meeting strangers on Grindr, Tinder, etc. The difference is that they are more likely to wash their hands afterward.
“says people can … meet a new friend, go to the friend’s house”
I would respectfully suggest that you’ve misread the article!
Can I ask a blunt question? Were you aware that the UK is on lockdown (“ongoing restrictions to people’s movements,” “more intensive social distancing measures”) when you wrote up this post?
Russil: I was aware that the U.K. called itself “locked down” and that they had shut some stuff that the government actually controls, e.g., schools. But that is not a real lockdown, as the scenario above shows. All of the stores that I mentioned are open. While the government may be saying “Don’t go visit your new Tinder friend and have sex”, that has the same practical force as when the government says “Eat broccoli instead of french fries.” The British government doesn’t have a Telescreen in every home where they can monitor whether someone coming in is a resident or a visitor (theoretically forbidden or at least discouraged). The police can fine someone 30 pounds ($36) for visiting a Tinder date, but how do they know if someone is driving to his/her/zer/their house or not?
(Regardless of what will and won’t happen during the non-locked lockdown, it was imposed only a few days ago. So if Professor Ferguson is correct about the peak in caseload occurring just before Easter, the lockdown won’t have too much effect on that.)
Thanks, Philip.
The lockdown doesn’t have to be perfect to reduce the spread of the virus. The Imperial College model used the following assumptions for suppression (“social distancing of entire population”), which limits the spread of the virus as long as it’s in place (Figure 3): “All households reduce contact outside household, school or workplace by 75%. School contact rates unchanged, workplace contact rates reduced by 25%. Household contact rates assumed to increase by 25%.”
“Regardless of what will and won’t happen during the non-locked lockdown, it was imposed only a few days ago. So if Professor Ferguson is correct about the peak in caseload occurring just before Easter, the lockdown won’t have too much effect on that.”
Once again, this is a misreading. Ferguson is saying that the lockdown is what causes the predicted case load to peak instead of continuing to climb. You seem to be interpreting his comments as meaning that the lockdown isn’t needed.
> the lockdown is what causes the predicted case
> load to peak instead of continuing to climb
In the March 16th paper, that peak is only the first. Figure 3 shows the “suppression” curve peaking after two or three weeks (the green line in 3B). The New Scientist article also has a peak at two or three weeks. So far they agree.
But in the article it’s become thepeak. What happened to the later and much larger peak shown in 3A? The March 16th paper says “Once interventions are relaxed (in the example in Figure 3, from September onwards), infections begin to rise, resulting in a predicted peak epidemic later in the year.” Where did that go?
Russil: I guess we can be shocked that Professor Ferguson does not say “My competitors are Oxford were right and you should stop listening to me”! Maybe Sweden will provide the control for the experiment being run by the U.K. They’ve done essentially nothing so far, right, in terms of a lockdown?
Lord P: Table 4 in the original Ferguson paper can’t be squared with his current 20,000 deaths forecast, can it? An R0 of “just over 3” is literally off the chart and even with suppression in place more than 80 percent of the time for 2 years would result in at least 100,000 deaths (extrapolating from the 2-2.6 R0 entries).
I don’t see how his Figure 4 is consistent with his current statements. It doesn’t even contemplate suppression strategies starting until early April 2020. It depends on an R0 of 2.2, not the “over 3” that he is currently assuming.
On page 16 of the original paper, he says that “even if all patients were able to be treated, we predict there would still be in the order of 250,000 deaths in GB”. So in a perfect world where UK society was suppressed more than 80% of the time and therefore every patient had access to a fully equipped ICU, 250,000 would die just in Great Britain (not including Northern Ireland). He is saying now that, in an imperfect world where the hospitals are hanging on the hairy edge of figuring it out, 20,000 will die in the entire UK (including Northern Ireland).
Figure 3 shows what would happen if lockdown is simply lifted in September. Instead, the Imperial College report proposes an adaptive strategy: basically, lift the lockdown whenever the number of new cases (measured weekly) drops below a low-water mark, and reimpose the lockdown whenever the number of new cases rises above a high-water mark. This is shown in Figure 4. You can see that the initial peak is much higher than the subsequent peaks. Table 4 shows the predicted results (column labelled PC_CI_HQ_SD).
Philip: Table 4 shows how the number of deaths varies depending on both R0 (between 2 and 2.6) and on how quickly lockdown is triggered. With a higher R0 = 3, you can compensate (reducing the expected number of deaths) by triggering lockdown more quickly.
“On page 16 of the original paper, he says that “even if all patients were able to be treated, we predict there would still be in the order of 250,000 deaths in GB”. So in a perfect world where UK society was suppressed more than 80% of the time and therefore every patient had access to a fully equipped ICU, 250,000 would die -”
Once again, I respectfully suggest that you’ve misread the report! What’s the scenario being described in this paragraph?
Russil: I think the paper is a bit confusing in how it zigzags between two vague terms (“mitigation” and “suppression”), neither of which are a good fit for what has or will happen in the real world. But there is still no way that the professor’s current statements can be consistent with the paper. The paper does not contemplate “suppression” until April, so if we accept whatever the UK government has done in the last few days as “suppression” (I wouldn’t; people will still be mixing in shops, in bedrooms post-Tinder, etc.), it isn’t an example of what the March 16 paper was suggesting. For him to be currently forecasting 20,000 deaths given an R0 of more than 3 is an indication that he hugely overestimated the lethality of the virus in the March 16 paper. (Of course, we have no way to know whether his March 16 paper or his March 24 updated viewpoint is correct!)
Philip: “mitigation” and “suppression” are certainly jargon, but they’re not difficult to figure out. The paragraph is talking about what happens without lockdown, not with lockdown.
“The paper does not contemplate ‘suppression’ until April -”
The paper is recommending acting ASAP, which is pretty much what happened. The sooner R0 can be reduced below 1, the fewer the deaths.
Russil: If it makes you feel better to think that the U.K. government closing the schools starting the week of March 23 (and urging citizens to do their drinking and Tindering serially rather than in parallel) cut deaths from 250,000 to 500,000 down to 20,000 and moved the peak from May-June to early April, and therefore none of this guy’s assumptions have in fact changed, I won’t rain on your parade!
> Figure 3 shows what would happen if lockdown is simply
> lifted in September. … lift the lockdown … and reimpose
> the lockdown …
The New Scientist article, however, is silent on all that. On the contrary it says (emphasis mine) “the predicted peak of the epidemic arrives in two or three weeks”. Where did the other half-dozen or so peaks and lockdowns go? Are they still predicted?
There are multiple “peaks”, each delayed by several days:
1. The peak in new infections per day.
2. The peak in known tested cases per day.
3. The peak in fatalaties per day.
Alternatively there is a peak defined as the point of inflection (negative derivate) of the growth rate.
@philg – I bought Drake’s FAPT text many years ago on your recommendation.
Treating the function of daily deaths vs time as a Normal function (Farr’s Law)
Peak increase in daily deaths ( ln(day_n/day_n-1) ) has already passed – both US and globally. Which means we’re inside of 1 standard deviation of peak daily deaths. (the 1 sd point is the inflection point of a Normal curve)
Also means you can multiply cumulative US deaths to date by no more than 6x (1/0.16) to estimate total deaths, since we’ve seen 16%+ of the cumulative distribution so far (past the 1 sd point)
I get between 5-6k US deaths. total. Possibly as little as 4k
i.e. bottom range of normal flu season.
@anonymale
https://www.naturalnews.com/wp-content/uploads/2020/03/coronavirus-deaths-usa-2020-03-26.png
So you are saying the number of deaths shown by this curve is going to drop to zero in the next three or four days?
henry: NYT says 1,222 have died in the U.S. as of today. For Anonymale’s forecast of 5-6k to be correct and also his forecast of following Farr’s Law, wouldn’t the curve have to keep rising until roughly 3,000 deaths have occurred, then begin to decline? (but not immediately to 0)
That sort of simplistic formula only applies in a fixed homogenous population. This epedemic is coming in a wave, and will spread to new uninfected areas. If the lockdown is enfoced the rate of spread will slow, and the total population exposed will be lower. Its impossible to extrapolate at this stage.
Hi Phil! Long time no see (it’s been a couple decades).
I lead a team at Google doing probabilistic epidemiological modeling, and I’ve spent some time studying this. No study is perfect. The Imperial College study had some real problems, most notably that it ignored the possibility of contact tracing. On the other hand, the Oxford study model (I’ve read this in detail) has a very clear problem: it assumes that the total infectious period (time from exposure to when a person is no longer infectious) is 3-4 days. This is pretty obviously at odds with the actual course of the disease here, which is roughly “a few days until symptoms show up, then ~10 days of infectiousness”, and this 3-4 day period is totally necessary to drive the result. We can’t definitively argue from this that the *claim* is wrong (there could still be some other way that a large fraction of the UK is already infected, altohugh I don’t know any such argument), but the model and the paper don’t provide good evidence for the claim.
Rif: Thanks for this analysis! Maybe we need to go back to the good old days and get our forecasts by having trained experts read entrails!
Interesting feedback! Part of the problem is that many competent scientists can come up with different plausible models, but there is insufficient data to determine which is applicable. In technical terms there are too many ‘degrees of freedom’ to solve algebraically. Problems with the data include various definitions of death, infection, and testing, which are different in many countries. As usual more data is needed, but this will take time and expense.
> (And what does 20,000 deaths actually mean? Are they people who would have lived another 50 years in great health? Or mostly people who would have died within a year or two from an underlying condition?)
> “In the UK’s health system, rationing isn’t a dirty word” says that the U.K. won’t spend more than $40,000 to keep someone alive for another year in good health.
Especially in times like these, the entire United States should make an allowance that people who are in the terminal phases of this illness can express in advance their legal wish to end their lives peacefully, with the assistance of a doctor. Those physicians should be available to patients and the process of procuring the compounds should be streamlined. If someone is in unbearable pain, hooked up to a ventilator (or not, because there aren’t enough of them), with doctors and critical care staff that will have to make the choice of who lives and who dies, patients should be able to express their preference in advance. Get the patient out of their terrible misery and allow the equipment to be used by someone else.
There’s a lot to digest here. You need to register but it’s free.
https://www.medscape.com/viewarticle/917092
I’ve listened to Neil Ferguson testimony that NewScientist article is based on. There’s an interesting quote about “excess deaths”. He thinks up to 1/2 – 2/3 of all COVID-19 deaths could be people who would die this year regardless of COVID-19.
“We don’t know what the level of excess deaths will be in this epidemic. By “excess deaths” I mean – by the end of the year, what proportion of those people who died from COVID-19 would have died anyhow. But it might be as high as half to two thirds of the deaths we are seeing from COVID-19. Because it’s affecting people particularly either at the end of their lives or who have other conditions.”
https://parliamentlive.tv/Event/Index/2b1c71d4-bdf4-44f1-98fe-1563e67060ee (10:43:00)
This blog is on track to be wrong on just about everything regarding the coronavirus. From calling it the “coronapanic” and hinting government measures are a gross exaggeration, to the UK doing it right (herd immunity) and not locking down everything, to Russia not being affected, etc., etc.
Most of Philip’s blog posts have been controversial/counterfactual (except on aviation). Have you only noticed now?
F: I hope that I don’t give the impression that I know what the optimum policy would be. I think it is a fair characterization of the current situation as “panic.” Given the limited data available, there is an open question as to whether the panic is justified. Given that our state public health systems are unable to test and contact trace with Singapore, Taiwan, and South Korean efficiency, it may well be that our best option is a shutdown.
That said, the “shutdown” here in Massachusetts does not seem likely to slow down R0 by much. People who would have met and mixed at work are now meeting and mixing, without masks, in packed grocery stores. I visited friends yesterday and chatted with them from about 8′ away from their front door. They’d gone to the special senior hour at Market Basket in Waltham, MA. This is a strip mall with several other big stores, including a Marshall’s. At 6:15 am, before any of the other stores were open, every parking space in the mall was taken. The supermarket was packed. Hardly anyone shopping of working there was wearing a mask. How is this population protected if they then spend the rest of the day at home?
(I had kind of the same experience at Costco Waltham at 10:15 am on Wednesday. 1 in 25 shoppers was masked. None of the employees were. The store was about as crowded as it would have been on a typical mid-day weekday.)
@anonymale
You gave this estimate based on your epidemiological model of US deaths :
“I get between 5-6k US deaths. total. Possibly as little as 4k
i.e. bottom range of normal flu season.”
Today however the US has cumulative deaths of
6,946 with +876 of those occurring in last 24 hours
Would you care to explain what factors account for the large mismatch in your prediction and reality?
Many people have made a fundamental mistake, confusing the number of positive cases with the number of actual infections. During the exponential phase of the epidemic (pre-lockdown), this produces a gross underestimate of rate of spread. Due to the lenghty incubation and illness duration, the actual scale only becomes clear once people actually start dying.
N.B. This is also related to the ‘backwards’ question, why Italy had such a ‘high’ death rate. They were not doing enough tests, which skewed the denominator in the mortality ratio.
I already answered part of the question (above). I forgot to type my name so it showed as anonymous:
Anonymous says:
March 27, 2020 at 6:28 am
That sort of simplistic formula only applies in a fixed homogenous population. This epedemic is coming in a wave, and will spread to new uninfected areas. If the lockdown is enfoced the rate of spread will slow, and the total population exposed will be lower. Its impossible to extrapolate at this stage.
Henry: My own predictions have been between 80,000 and 150,000, so I disagree with Anonymale. On the other hand, fully half of U.S. deaths have been in the New York City metro area (nobody seems to care about those in NJ, but I think they are just as hard hit). That NYC would be such an outlier was tough to predict. If we take those out, Anonymale isn’t yet spectacularly wrong (but I haven’t changed my lower bound estimate of 80,000 so I do think he will be proven wrong).
“That NYC would be such an outlier was tough to predict.”
I would guess they’re just ahead of the curve. That is, the virus is also spreading elsewhere, it just hasn’t shown up in hospitalizations and deaths yet.
March 25: about 1000 deaths. March 28: about 2000 deaths. March 31: about 4000 deaths. April 3: 7400 deaths. Looks like the social distancing measures from a couple weeks ago are slowing the exponential growth a bit.
Am I misreading this? Did the federal government just seize a shipment of N95 masks that Massachusetts had purchased to protect their health care workers, forcing Massachusetts to transport their next shipment in a semi-clandestine way using a private plane owned by the New England Patriots? Because that sounds completely insane.