Back in September 2021, we looked at a New York Times article that explained the #Science of Deplorability leading inevitably to death from COVID-19. States and counties in which people voted for Trump were subject to high death rates. Cities packed with righteousness (Biden voters) were sailing through whatever SARS-CoV-2 could dish out more comfortably than a New York City hospital executive holed up on the Palm Beach waterfont.
In the comments, Steve wrote “Coastal America (blue states) tend to have mild summers, and long dreary wet winters.” I responded with a throwback to pre-coronascience, suggesting a hypothesis to test:
Maybe Vermont would be a good test for your theory. They have the nation’s highest vaccination rate. They have the nation’s lowest cumulative COVID-19 death rate (still higher than India’s, though, which was portrayed as a world-ending disaster by our media). They enthusiastically voted for Joe Biden in 2020 (largest margin on the NYT chart).
Also, California and Maryland. The NYT says that these states are being spared currently because they’re populated by Democrats. Presumably that isn’t going to change and, in fact, they’ll become more solidly Democratic as Deplorables seeking freedom move to Florida, South Dakota, and other comparatively free states.
If we want to be scientific about this, where “scientific” has its pre-Covid definition of put forward a hypothesis first rather than retrospectively providing an explanation for how it is the fault of the unvaccinated or the Republicans, etc., we need a date and an outcome.
How about if the hypothesis is that Vermont suffers a fall/winter Covid wave that kills at least 50 percent as many people, adjusted for population, as the current wave in Wyoming, singled out for Deplorability in the NYT article? We pick March 1 as the “end of winter” (and September 1 for the start of fall?)? And the hypothesis test is discontinued if some dramatically effective medical treatment for COVID-19 becomes available prior to March 1 (i.e., the treatment that I wrongly predicted would be available no later than March 2021; see https://philip.greenspun.com/blog/2020/04/06/best-guess-as-to-when-the-first-successful-covid-19-therapy-will-be-widely-available/ (I give myself credit only for saying “I’m a big believer that viruses are smarter than human beings.”)). Wyoming has such a small population that it might be challenging to say when the current wave is over. The NYT characterizes Wyoming as a place where people are dying left and right. Your horse or pickup will have to navigate around corpses in Jackson. Yet the Google shows a 7-day average death rate currently of 6 people. Not 6 people per 100,000. 6 deaths per day total in WY. The wave can be declared over when this falls to 1?
California and Maryland have already suffered the loss of quite a few residents tagged to COVID-19. They’re thus more similar to West Virginia, also singled out for Deplorability in the NYT article (relatively high death rate right now on top of a medium cumulative death rate; many evil voters who chose Trump). So the hypothesis for those states can be that they have fall/winter waves that kill at least 50 percent as many people, adjusted for population, as the current wave in West Virginia. We look at deaths from September 1 through March 1 in these states. We say that the current “wave” in WV is over once the number of deaths per day comes down to fewer than 6 per day.
Although true coronascience is done by looking at the data and spinning a retrospective hypothesis, let’s look at the above hypothesis from September 2021 and compare to data received since. What do we find? Is whether a person voted for Donald Trump sufficient to predict his/her/zir/their chance of being felled by the mighty coronavirus?
Note that the New York Times didn’t formulate a hypothesis other than “red states bad” but it did a February 18 update:
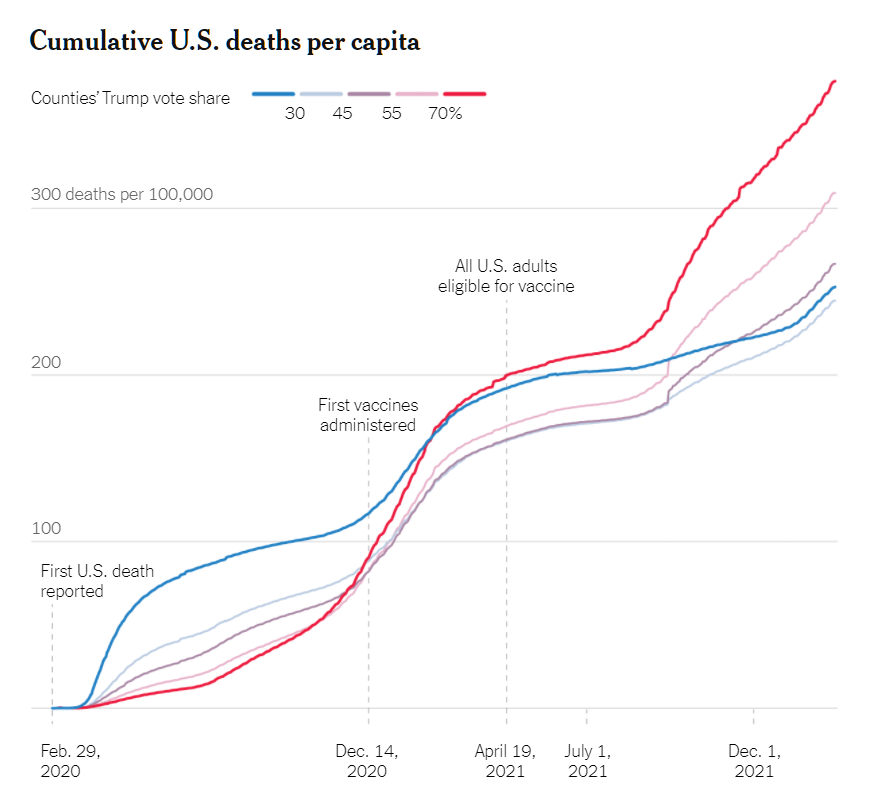
It looks like the NYT’s hypothesis might be correct. Supporting Biden, and having neighbors who support Biden, protects a person from COVID-19-tagged death. On the other hand, the above chart is not adjusted for median age. Younger people are more likely to vote for Democrats and much less likely to die from/with COVID-19. There are huge state-to-state variations in the percentage of population over 65 (California is very young, for example, which helps it look good in the COVID Olympics; 15% of population over 65 compared to 21% in Florida). Especially when looking at all counties in the U.S., there would have to also be huge variations in the percentage of over-65s in those counties (just comparing all California counties to all Florida counties, for example, would result in a massive disparity in COVID-19 vulnerability). Rural counties were more likely to vote for Trump and they’re also packed with COVID-vulnerable seniors (19 percent of population compared to 15 percent in urban/metro counties (USDA)).
We might also need to adjust for the type of work being done in these counties. A county packed with work-from-home, welfare-from-home, or cash-alimony-and-child-support-checks-from-home Zoom heroes might be more protected from COVID-19 deaths than a county packed with people whose job requires in-person effort (God forbid!).
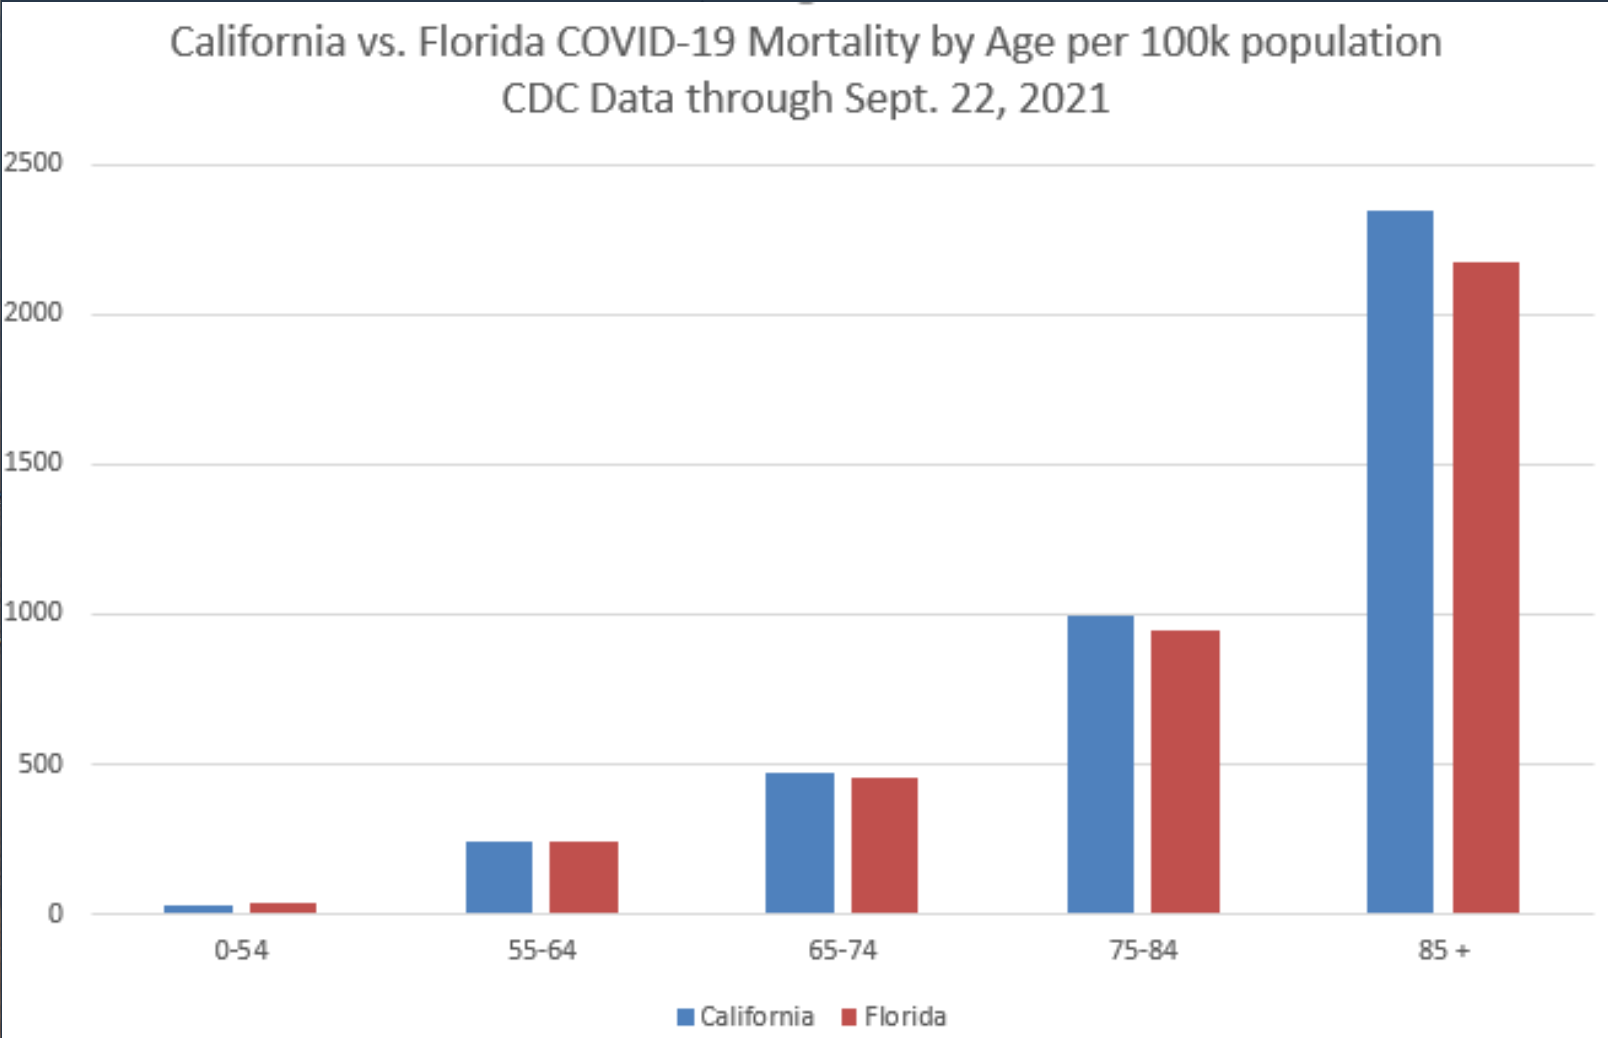
Jay Bhattacharya’s fall 2021 tweet reminds us that adjusting for demographics gives a different picture than a raw death rate.
> The NYT says that these states are being spared currently because they’re populated by Democrats.
It’s interesting and little bit off-argument, but I have a relative who lives in a relatively rural but upscale “collar suburb” area of MD (median home market value: >$500,000) and he caught COVID-19 back in July of 2020. He is a BIG B Demosocialist, meaning a dyed-in-the-wool Bernie Sanders supporter. What does he do for a living? Social Worker in the Baltimore area. He was one of the earliest and most fervent mask adherents, wore N95s and I cannot tell you how many times he screamed at the top of his lungs on the Interwebs about how much he despised Donald Trump, because they are innumerable. But despite the Masks that Work and living in a beautiful and upscale rural area, he brought the plague home – presumably from his day job in Baltimore – to his wife, his adolescent kid, and also his mid-late 70’s mother. All of them caught it and all of them recovered without much trouble, which I attribute to their relative lack of comorbidities – nobody is obese (one is a little paunchy but that’s it), they’re all nonsmokers, nobody has heart disease or diabetes, general clean living, plenty of fresh air, and maybe good genes.
Please resume the argument, I want to take up your broader question myself in a later post.
> We might also need to adjust for the type of work being done in these counties. A county packed with work-from-home, welfare-from-home, or cash-alimony-and-child-support-checks-from-home Zoom heroes might be more protected from COVID-19 deaths than a county packed with people whose job requires in-person effort (God forbid!).
In other words, my relative’s experience suggests that early and frequent in-person contact with Plague Victims might have something to do with spreading the Plague! The Zoom heroes avoided that, my relative did not, and he maintained his in-person schedule until he had to quarantine.