I’ve long yearned for a state-by-state map that has similar “excess death” data to what Our World in Data delivers for countries (no-lockdown no-mask-order Swedes holding steady at 5%, substantially lower than the countries celebrated for their police- and military-enforced lockdowns).
Courtesy of heretic Stanford Medical School professor Jay Bhattacharya, I finally have one! It’s from the cheerfully named web site “US Mortality”. Here’s a link directly to the map:
In my opinion, the map tends to show that the Church of Sweden MD/PhDs were correct when they predicted, back in March 2020, that government policies in the West would have at best a small effect on total death rate. How does the map show this when different states are in different colors? SARS-CoV-2 likes to kill those of us who are carrying extra pounds. Here’s a CDC map of adult obesity:
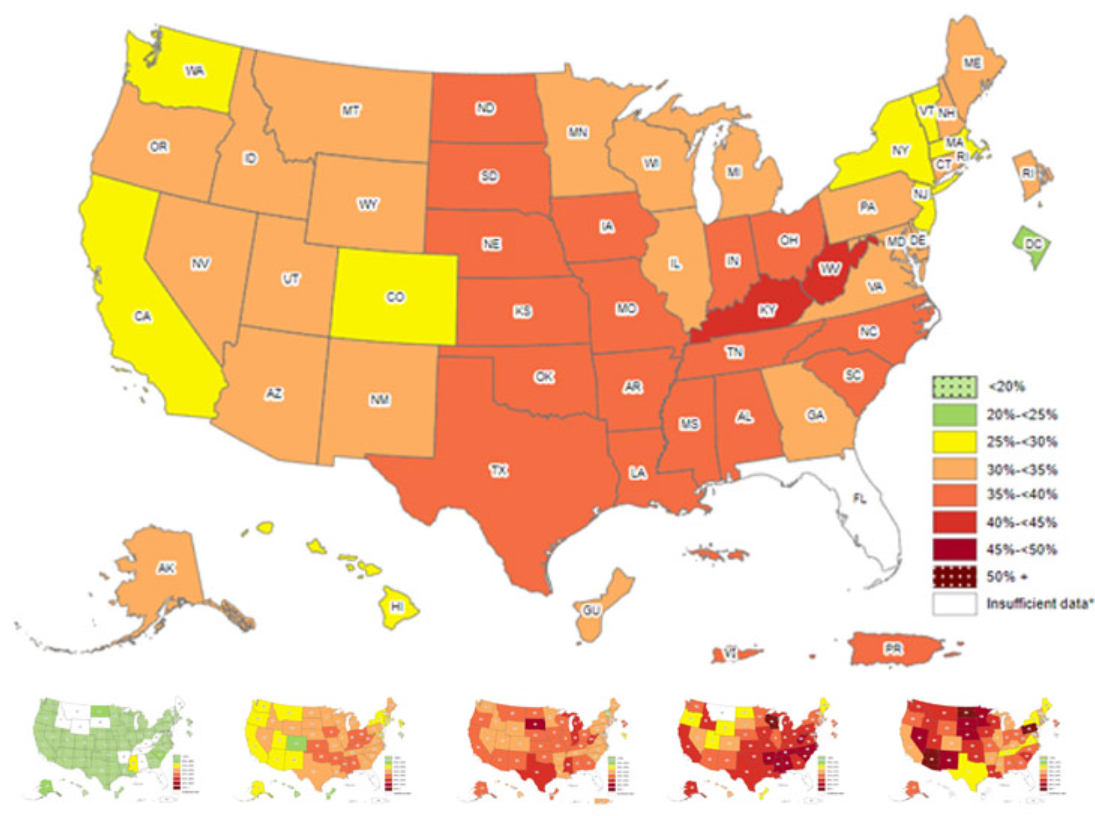
(No data for Florida? You’d think those CDC folks would love to be on South Beach and Marco Island rating body shapes!)
To my eyes, the obesity map explains most of the pattern that we see in the excess deaths map. (You’d also want to look at percent of population over 65; a state that is all young people should have an extremely low rate of both COVID deaths and excess deaths.)
A few highlights…
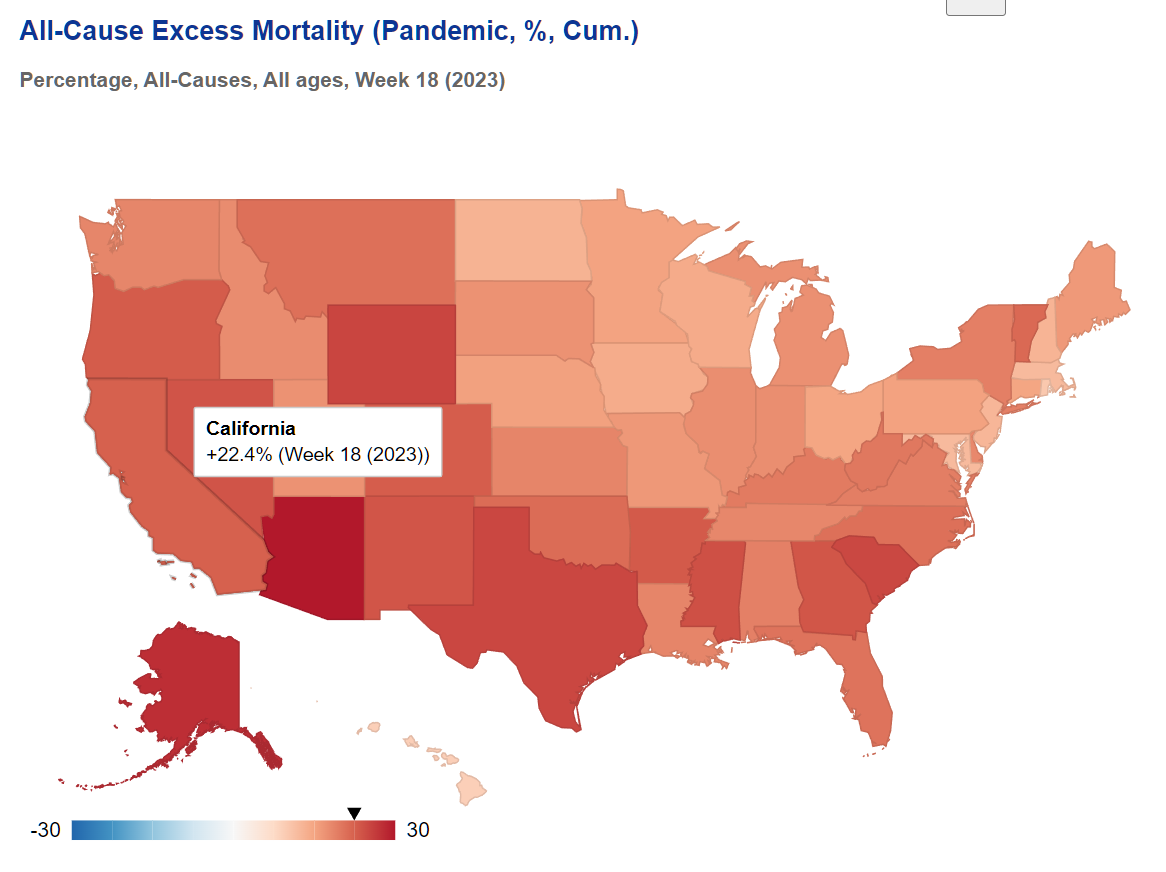
California with its Science-following fully-masked schools-closed vaccine-papers-checking population suffered 22.4% excess deaths compared to 20.4% in Science-denying irresponsible Florida (inherently vulnerable due to 21% of population over 65). Considering how many Californians were paid to stay home (either working as members of the laptop class or not-working as members of the welfare class) and considering that Californians are slender (CDC map) and young (only 15% of population over 65), this might be the worst performance among all states. Colorado was a close second (slender, young, and a 22.8% excess death rate).
The geniuses at University of California, Berkeley celebrated Vermont, Alaska, and Maine as “the three most effective states in responding to the coronavirus pandemic last year”. How did the Scientific prediction from March 2021 work out? Without a city of substantial size, Vermont had 21.5% excess deaths, almost the same as New York (19.1%). Alaska was off-the-charts bad at 27.7%. Maine turned in a reasonable 16.3% performance, so long as you didn’t mind lockdowns, mask orders, school closures, and vaccine coercion (through May 13, 2022).
Kristi Noem was pilloried for refusing to follow Faucism in South Dakota, but her state had 17.1% excess deaths despite a high percentage of obese adults (see CDC map above).
Kentucky’s Democrat governor was celebrated for “halting the spread of COVID-19” while the Republican fool running Tennessee was slow to order lockdowns (The Guardian). Tennessee ended up with a lower excess death rate. (Possibly explained by a higher obesity rate.)
Not counting Hawaii, Maskachusetts and New Jersey had the lowest rates of excess deaths. Some of this is probably explained by the fact that people in MA and NJ are virtuously thin (CDC map). There are also a large percentage of laptop class folks in both states who were able to stay home in their suburban bunkers. But maybe I will be forced to admit that closing Boston schools for more than a year, ordering people to wear cloth face rags on quiet suburban streets, and demanding that children show their vaccine papers were effective measures!
(People who aren’t cisgender white heterosexuals might nonetheless want to avoid Massachusetts, home to “the country’s second-highest number of white supremacist propaganda incidents in 2022” (considering the small population of the state, this is off-the-charts bad per capita). “Hate in the Bay State: Extremism & Antisemitism in Massachusetts, 2021-2022” (ADL):
Amidst increasing nationwide threats to the LGBTQ+ community, Massachusetts has also witnessed a spike in anti-LGBTQ+ activity, including waves of harassment against Boston Children’s Hospital, drag performances and LGBTQ+ events. And as the numbers of antisemitic incidents continue to rise across the country, Massachusetts was no exception. According to ADL’s annual Audit of Antisemitic Incidents, it was the sixth most affected state in the country in 2022.
Massachusetts saw a dramatic rise in antisemitic incidents, according to ADL’s annual Audit of Antisemitic Incidents. In 2022, the number of incidents increased 41% over 2021 levels…
ADL documented 34 white supremacist events in the state in 2021 and 2022, including protests, meetings, flash demonstrations, banner drops and marches.
In 2022, ADL documented 465 instances of white supremacist propaganda distribution across the state, an increase of 71% from 2021 (272).
In May 2022, a student in Waltham brought a knife to school, threatened his Jewish classmates and held the knife to the throat of a Jewish classmate.
Since 2021, the Nationalist Social Club, also known as NSC-131, has grown rapidly to become one of New England’s most active white supremacist groups; their presence is particularly robust in Massachusetts.
Massachusetts is a hotbed for anti-LGBTQ+ extremism, which increased nationwide in 2022
Patriot Front is a Texas-based white supremacist group with members all over the country, but they have become increasingly active in Massachusetts because of the state’s ties to the founding of the United States.
The last point strikes me as odd. Wouldn’t the Patriot Front need to find enthusiastic supporters in a state in order to be “increasingly active”? The history of the state doesn’t seem relevant.
The mention of Waltham made me nostalgic. When we lived in adjacent Lincoln I used to offer neighbors whose lawns sported Black Lives Matter signs a free trip to Waltham in our minivan: “You can have a look at some actual Black people.” This did not make me as popular as I expected.)
CDC obesity data: “Prevalence of SELF-REPORTED Obesity ” Lol. More credible would be provided by Jason Blair NYT. GIGO. Keeps folks at CDC busy.
perplexed: NHANES is a sample of only 5,000 Americans, but it is supposed to be representative via statistical magic. I wonder why they’re not using that to estimate obesity. It includes BMI. https://wwwn.cdc.gov/nchs/nhanes/tutorials/default.aspx (maybe one of our energetic readers will download and give us the state-by-state BMI!)
Massachusetts is the 2nd most liberal state in the union, based on Biden vote margin. Only Vermont is more liberal.
Perhaps it isn’t surprising that Massachusetts also has the 2nd highest level of white supremacist literature, given that much of it is produced by liberals, sometimes as hoaxes or propaganda.
Most days, boston.com has a story featuring the bigotry of Massachusetts residents. Today’s version: https://www.boston.com/news/books/2023/05/23/local-librarians-under-attack-amid-record-number-of-national-complaints-and-challenges/
Never knew any single women who could go 50ft without driving even in the yellow states. Fl* is definitely bad from just looking around.
Florida is bad? Not judging by Miami Beach beaches in the winter and not during the college break. I thought that everything was slim in Florida in comparison with yellow states. Da map is not about geographic BMI, it is about geography of how people feel about themselves. Maybe they just put the data in without bother after looking at Hollywood and Manhattan Upper East Side pictures.
lion: Our neighbors in Palm Beach County are generally slim, at least by current American standards (maybe not by 1960s standards).
Here’s a tweet containing a depressing trend chart from a med school prof:
https://twitter.com/robertlufkinmd/status/1660658855712374787?s=20
How does this graph compare to the one generated by the NYTimes?
Go here: https://www.nytimes.com/interactive/2021/us/covid-cases.html
Scroll down to the country map
Click “deaths per capita”
Or if you look at the table data, choosing all-time deaths per capita, we see:
– Arizona: 456 per 100k
– Florida: 406 per 100k
– California: 264 per 100k
I know these are covid deaths vs excess deaths, but my sense is that those two numbers were similar enough in most cases.
And if these numbers are just faked by profit-seeking lib doctors, shouldn’t California’s number be _more_ of a lie than the other states?
David: The main problem with looking at COVID-tagged deaths in different states is that the age distribution is so different from state to state. A state that had no residents over age 60, for example, would have an extremely low death rate. California is one of the youngest states in the U.S. and therefore you’d expect it to have a low rate of both COVID-tagged deaths and excess deaths. https://www.prb.org/resources/which-us-states-are-the-oldest/
I should edit the original posting to talk about age distribution!
Something seems unsatisfying about “Florida had 50% more deaths per capita from covid, adding up to 10s of thousands of people, but that’s fine because we have 50% more deaths in most years”
No need to cherry-pick Florida. The NY Times has broken out data for all 50 states.
So you can choose “all time”, sort by deaths per capita, there’s a definite trend of red states with low vax rates and high death rates and blue states with high vax rates and lower death rates.
I’m also saying this as someone from SF, where people had the highest compliance rate and lowest death rates.
@philg, it is pretty clear that excessive death statistics accounts for age, there is no need to drop level of discussion to the lowest common denominator to engage in reactive random comment rebuttals.
perplexed: excess death stats do NOT account for the age-targeting of SARS-CoV-2. The baseline deaths that you’d expect account for deaths due to other disease that kill the old, e.g., diabetes and cancer. To understand this, consider a hypothetical virus that infects 100% of humans and kills 100% of humans over age 65, all within a month. Then consider a hypothetical state in which every resident is over 65. The average resident had perhaps 200 months to live. The “excess deaths” in this state would be roughly 200X the usual (20,000%!) because the entire population would be killed in one month instead of 1/200th of the population.
David: You’d really want to know the percentage of the population over 72, perhaps, given that SARS-CoV-2 kills humans at a median age of 80-82, but we have easily accessible data for population over 65. Florida has 21% of its population over 65 so just from that one number you’d expect it to have 1.4X the COVID-tagged death rate of California, where only 15% of the population is over 65.
If today’s California children stay in California, California will ultimately lead the nation in COVID-related deaths because people with less education have a lower life expectancy. The California kids who missed 1.5 years of school will die at least a few weeks early, statistically, and according to Covidrithmetic, in which any shortening of a life is an equally counted “death”, they will therefore be “COVID deaths”.
Philip — I agree that “covid death rate for over 65 population” would be a better metric to compare.
However, this might also be problematic because if you compare the states with the longest lifespans vs shortest lifespans, it’s almost 100% blue states vs red states:
https://fortune.com/well/2023/04/01/top-10-states-highest-life-expectancy/
@philg, as you pointed out, excessive death statistics accounts for age by using residual life expectancy.
Those over age of 65 have let’s say 220 months life expectancy and new born have 960 month expectancy. Those over age of 100 have let’s say 6 month expectancy. So someone dying in CA with let’s say average life expectancy of 500 months increases increases excessive death statistics fro CA more then one death in FL which let’s assume has average 400 months life expectancy.
David: Thanks for that link to a map of blue v. red state life expectancy. Are you sure that it isn’t mostly a map of whiteness? “Life expectancy for Black people was only 70.8 years compared to 76.4 years for White people and 77.7 years for Hispanic people.” says https://www.kff.org/racial-equity-and-health-policy/report/key-data-on-health-and-health-care-by-race-and-ethnicity/
The map in your link seems to correlate with
https://en.wikipedia.org/wiki/List_of_U.S._states_and_territories_by_African-American_population
(The blue state life expectancy advantage should continue to expand because the elites in those states are replacing Black residents with “Hispanic” and “Asian” residents, according to the New York Times (see “Why Black Families Are Leaving New York, and What It Means for the City” at https://www.nytimes.com/2023/01/31/nyregion/black-residents-nyc.html : “Black children in particular are disappearing from the city”).)
I’m not making any claim about the source of the difference. Pulling the lever for Joe doesn’t automatically add years to your life.
But if someone wanted to look at the effect of covid policy in blue vs red states, and there was already a big difference between those states, that would need to be accounted for.
On NY Black people.. first I heard we were importing black/brown people to win elections, now we’re exporting them? I need someone to get the propaganda straight before I respond.
And if black families with kids are leaving nyc, sounds like they’re doing what all the white people I know have been doing for decades. Live in the city until they have kids, then move out where they can get more space and decent public schools. Good for them.
David: I am not sure that you read Pravda carefully. “The Rodneys are part of an exodus of Black residents from New York City. From 2010 to 2020, a decade during which the city’s population showed a surprising increase led by a surge in Asian and Hispanic residents, the number of Black residents decreased. … The city’s Black population has declined by nearly 200,000 people in the past two decades, or about 9 percent. Now, about one in five residents are non-Hispanic Black, compared with one in four in 2000, according to the latest census data. … Citywide, white residents now make up about 31 percent of the population, according to census data, Hispanic residents 28 percent and Asian residents nearly 16 percent. While the white population has stayed about the same, the Asian population grew by 34 percent and Hispanic population grew by 7 percent, according to the data.”
On the election angle that you raise, maybe this is why New York Democrats are so upset about the handful of migrants who have shown up recently. Democrats are already assured of victory in any NYC election, so importing future Democrats to NYC doesn’t have any effect on outcomes.
I followed all that. If there’s a democratic replacement theory machine at place, replacing black voters with hispanics and asians doesn’t help get democrats elected because black voters vote democratic in higher numbers than those other 2 groups.
This was exactly the point I made at Soros’ last meeting/orgy.
And not sure if 9% reduction in black population in a decade counts as an exodus.
The story says:
– Black population has dropped by 9%
– Number of black kids and teenagers has dropped 19%
– Birthrate among black women has decreased.
That all checks out. People get richer, have kids later, have fewer kids, and move to the burbs to give them a better life.
The most annoying part of that NYT story was making it sound like a crime against black people when it just sounds like what everyone else is dealing with in the city for years. Does that writer even live in New York?
“In Money’s best places to live 2020 analysis of 2,000 cities spread over 673 U.S. counties, we found that no place had a higher life expectancy than Collier Co.: A retiree paradise situated near the southern tip of Florida. The residents here live to an average age of 86 years old, according to the National Center for Health Statistics’ 2016-2018 Mortality Files. That’s about seven years older than the national life expectancy rate and almost two decades older than the lowest life expectancy in our analysis (Petersburg Co. in Virginia).
This retirement destination is home to Marco Island and Naples — cities best known for their tourism, fishing, golf, and luxury retirement communities.”
https://money.com/best-place-to-live-longest-life-2020/
What’s special about Collier County that they can enjoy a longer life expectancy than folks in Palm Beach County? Collier County is 89 percent white while our home of Palm Beach County is 74 percent white. https://www.census.gov/quickfacts/fact/table/palmbeachcountyflorida,colliercountyflorida/PST045222
An individual who drives across the Everglades from Palm Beach County to Collier County is not going to suddenly become healthier and live longer.
One thing worth considering is that the South and Southwest got hit hard by the “summer sunbelt wave” in 2020, and then hit again in 2021 by the deadly “Delta Variant”.
The high plains got hit hard in fall 2020 by the Alpha (laboratory) variant, but never by the Delta variant. Thus Kristi Noem exposed everyone to the less deadly Alpha variant and only had one bad wave that primarily took out people destined to die by 2023 anyway.
The northeast also got hit by the alpha variant in fall 2020 but was locked down pretty hard. By the time the deadly Delta variant was starting to wind up in the fall of 2021, the mild Omicron variant arrived from Gauteng and rapidly crowded out the original variant.
Vermont is a bit of a mystery, but I seem to recall the Delta variant was exploiting the near-zero herd immunity there by early fall 2021 thus they had a lot of hybrid infections before Omicron overwhelmed the area in January 2022.