The cost of owning a house in the U.S. can go up 1,000% and it would have no effect on the government’s official inflation rate, updated this morning to 3.5 percent. That’s because the cost of an owned house is included in CPI by asking homeowners, who aren’t landlords, how much they think they would get if they became landlords (usually not much because nobody wants to move into a single-family house with a one-year lease and then get kicked out at the end becuase the owner decided to do something else with the property). BLS:
The expenditure weight in the CPI market basket for OER is based on the following question that the CE Survey asks of consumers who own their primary residence: “If someone were to rent your home today, how much do you think it would rent for monthly, unfurnished and without utilities?”
ChatGPT says that OER rose by 31% from year-end 2019 to year-end 2025 (citing FRED).
What happened to actual costs? Nobody knows because the government doesn’t bother to measure them (see above). The Wall Street Journal, however, has a recent article on an attempt to quantify the rise in costs. It’s 39% rather than the BLS fantasy number of 31% if one considers someone who bought a house in 2025 vs. in 2019:
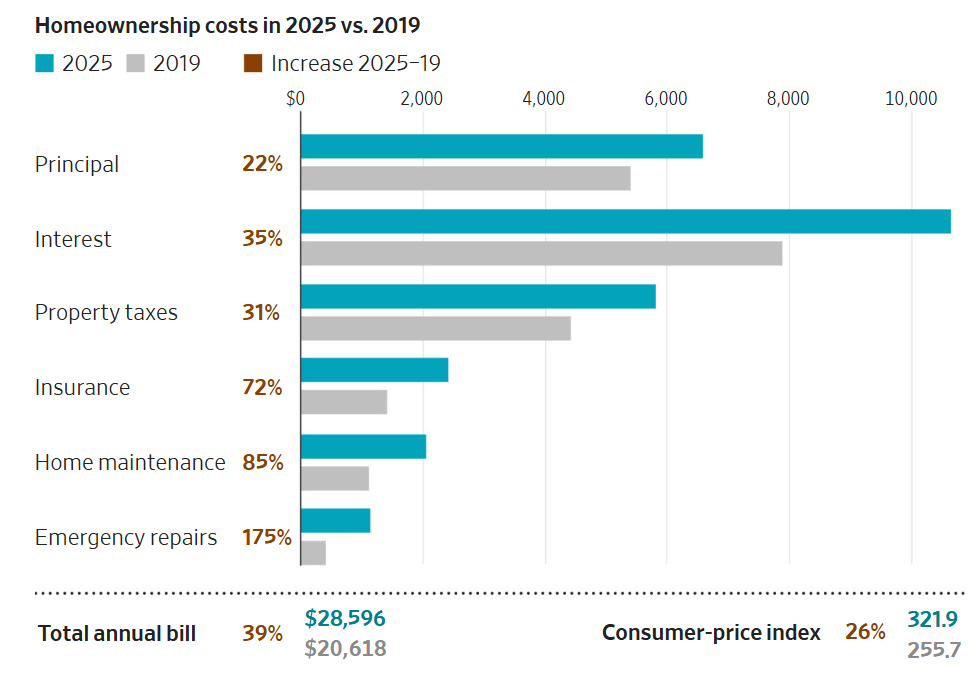
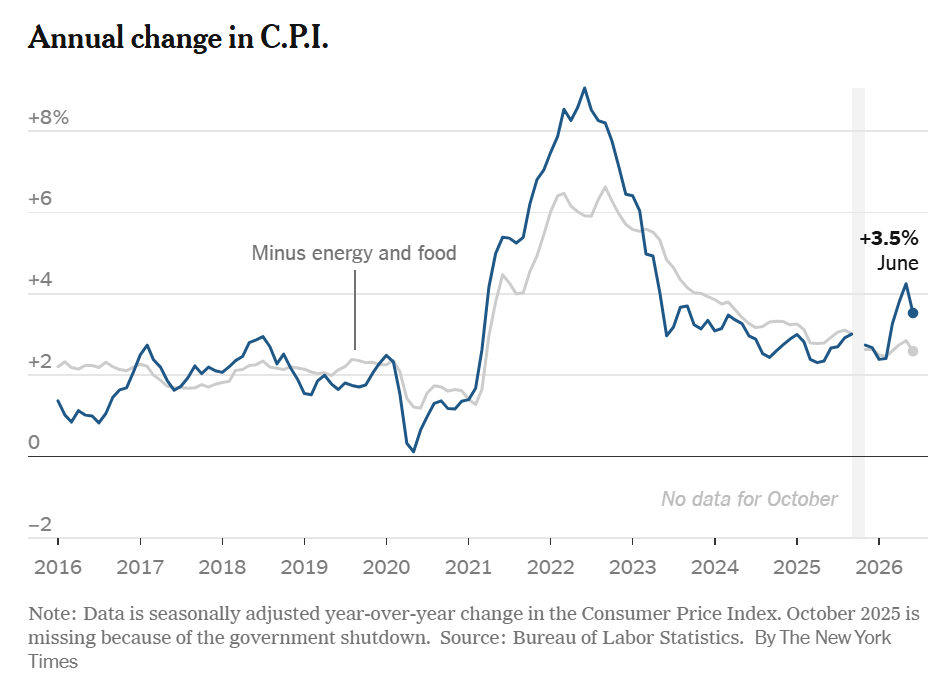
OER is about 26% of CPI so the effect of using OER instead of actual costs has been to understate inflation by about 0.3% per year over the 2019-2025 period coverd. That doesn’t sound like a lot, but it is about one-sixth of the Fed’s 2% inflation target (how are brightest technocrats doing on that, by the way? https://www.nytimes.com/2026/07/14/business/economy/inflation-cpi.html has a chart showing six straight years of failure to meet this target; six years is “transitory”?).
Related:
- “Comparing Past and Present Inflation” (Larry Summers, 2022): “we find that current inflation levels are much closer to past inflation peaks than the official series would suggest”
- “Summers: Inflation Reached 18% In 2022 Using The Government’s Previous Formula” (Forbes, 2024)
There was a proposal to use the salary increases at the Federal Reserve and other central banks as an inflation measure.
The brief drop in oil prices & continuing RIFs paid for June’s inflation. It seems you really can be 100% S&P 7 forever.
Phil, I must confess that I totally missed the biggest asset bubble ever leading up to the Great Financial Crisis of 2008. My forecast in July, 2005: “We’ve never had a decline in house prices on a nationwide basis. So what I think is more likely is that house prices will slow, maybe stabilize, might slow consumption spending a bit. I don’t think it’s going to drive the economy too far from its full employment path, though.”
But, you will be happy to learn that Anthropic has put me in charge of oversight of AI models! They told me they needed a trusted person to help forecast the “range of outcomes” from their AI models. So exciting!
Thanks, Ben, for recommending that I buy a huge portfolio of subprime mortgage bonds in 2005.
> Thanks, Ben, for recommending that I buy a huge portfolio of subprime mortgage bonds in 2005.
And for this the Nobel Foundation awarded Ben the prize in economics! (Little known fact.)
NH, the Nobel prize wizards adore elite Experts like Ben and me who are really good at forecasting stuff that is difficult for ordinary folks to understand.
@DrAG
I think once the |absolute value| is taken of both your accomplishments, the magnitude is quite high. I know you are humor challenged, and unlike Phil and his commenters I respect disability — that is a joke that your accomplishments are negative and suck. (I had to look you up on Wikipedia just now because I forgot who you were again while typing this.)
Congrats on the Nobel, if no one else has! Between your Chicken Little “predictions” and Elump’s “shut em down” DOGE, we now seem to have a crippled NWS. Current observations are always N/A in my zip code. The highs are like 75 deg. F +/- 100 deg. (By the way “Experts” does not need to be capitalized in your sentence, why don’t you act like an immigrant and learn the language. I was beginning to suspect you were DJT with that grammar, bro.) You aren’t welcome in the new hippy movement, and if you don’t leave we’ll have you trespassed. Adjö.
(DrAG, get it? Trans? Oh never mind.)