San Diego mosque shooting: What do Californians have in common?
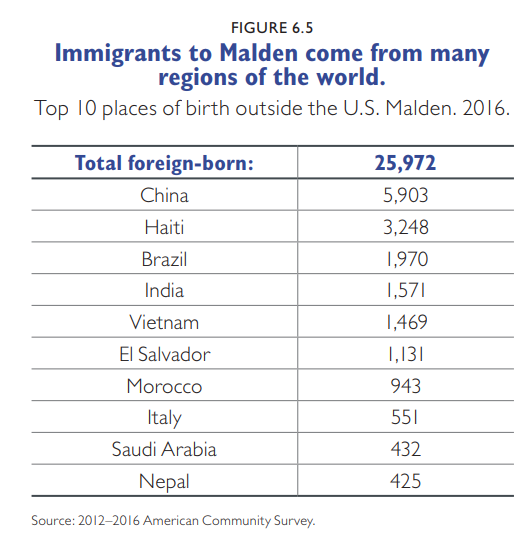
California is an exemplar for what a lot of Americans want our nation to become. It is 28 percent immigrants, for example. Taxpayer-funded unlimited health care is a human right, including for the undocumented (except, bizarrely, Californians who say that they hate inequality stopped giving MediCal to undocumented new arrivals while preserving it for existing beneficiaries; of course, a newly arrived undocumented migrant disqualified from MediCal due to a completely arbitrary arrival date limit can always get taxpayer-funded care at the nearest emergency room). Any day now, California will ladle out massive quantities of taxpayer funds to those who identify as “African Americans” (a committee was formed (see below) after the legislature passed a law requiring… a committee to be formed).
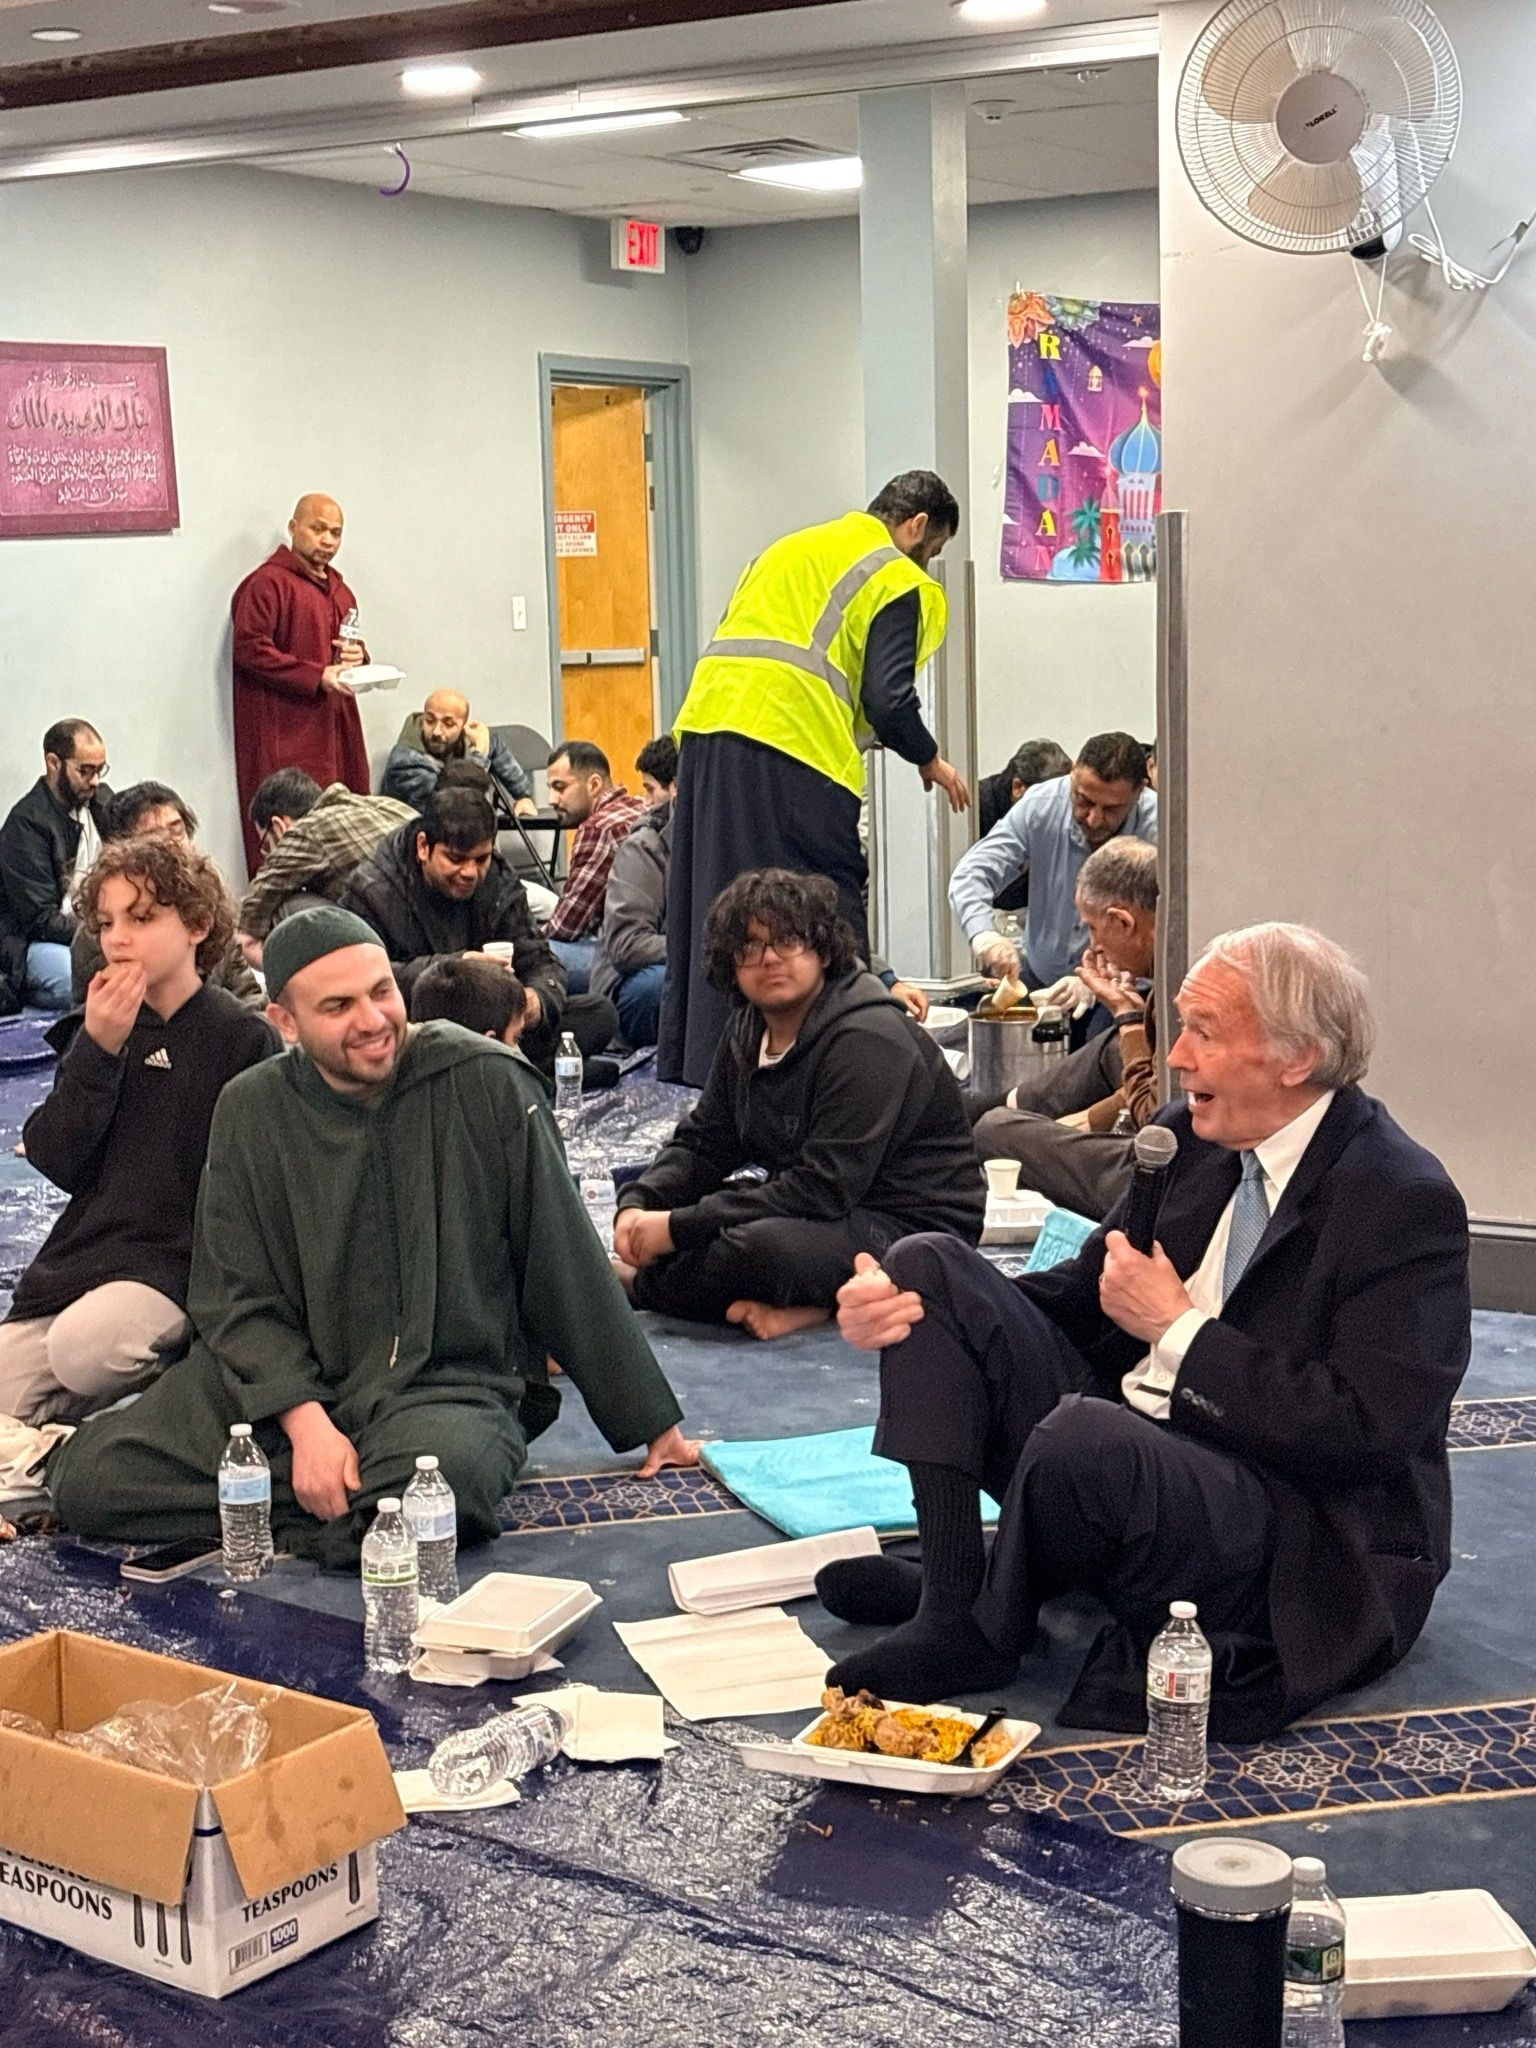
The unfortunate recent shooting at a mosque in San Diego involved a diverse group of people from different cultures and ethnicities.
Americans can’t agree on the nature of the mosque. It served an entirely peaceful group of Muslims, according to the Righteous at Wikipedia. The peaceful Muslims are mostly notable for being the victims of hatred:
The mosque was the target of an attempted bombing on January 11, 1991. The attempt occurred during a period of high tensions as part of the Gulf War, and the mosque received a large volume of hateful phone calls. The bomb was later discovered to be defective
(No culprit was ever identified or arrested, according to Google AI.)
It was the home for 2 out of 19 of the 9/11 hijackers, according to the Deplorables at the New York Post and was a center for Jew-hatred:
More recently, Imam Taha Hassane has come under fire for his comments on the Oct. 7, 2023, attacks.
“This did not start last week or on October 7. This is the result of brutal Zionist occupation and genocide,” Hassane said in a video posted to social media days after the savage Hamas attack.
“Resistance is justified when people are under occupation and don’t let them change that narrative.”
His wife, Lallia Allali, allegedly posted graphic images of a “Jewish star murdering babies with ‘the devil is killing’” scrawl in the wake of the Oct. 7 attacks
(The helpfulness of the mosque is confirmed by the National Commission on Terrorism Attacks Upon the United States (report).)
Another aspect of the shooting that we probably won’t see covered by mainstream media… “Muslim security guard killed by neo-Nazis made Facebook posts admiring Hitler, blasting Jews” (Not the Bee):
Two people who hated Jews killed another guy who hates Jews.
In other words, Californians from different backgrounds might be able to unite under an anti-Jewish political banner (perhaps, as with Zohran Mamdani, this will be styled as an “anti-Israel” banner, not too different from how German forward-thinkers rebranded crude “Jew-hatred”, offensive to middle-class Germans, to the scientific-sounding “antisemitism”, something that educated Germans could sign up for as a policy).
Except for agreement regarding the pernicious nature of Jews/Israelis, however, what do the people who currently live in California have in common? At one time, the answer might have been a shared economic interest. This was strained a bit during the early Silicon Valley boom, but the chip and electronics companies built factories in California as well as design labs. In the current AI boom, some people with IQs of 160-200 in the SF Bay Area work at desks and all of the high-value manufacturing happens in Taiwan. The data center construction and operation jobs that AI creates will nearly all be in states (and countries) other than California, which has a high cost of electric power. Absent state government confiscation and redistribution, it isn’t clear how profits from AI will reach Californians outside of the Bay Area (or even most of those who don’t work in AI and who live in the Bay Area).
Pew regarding the shift in data centers away from California:
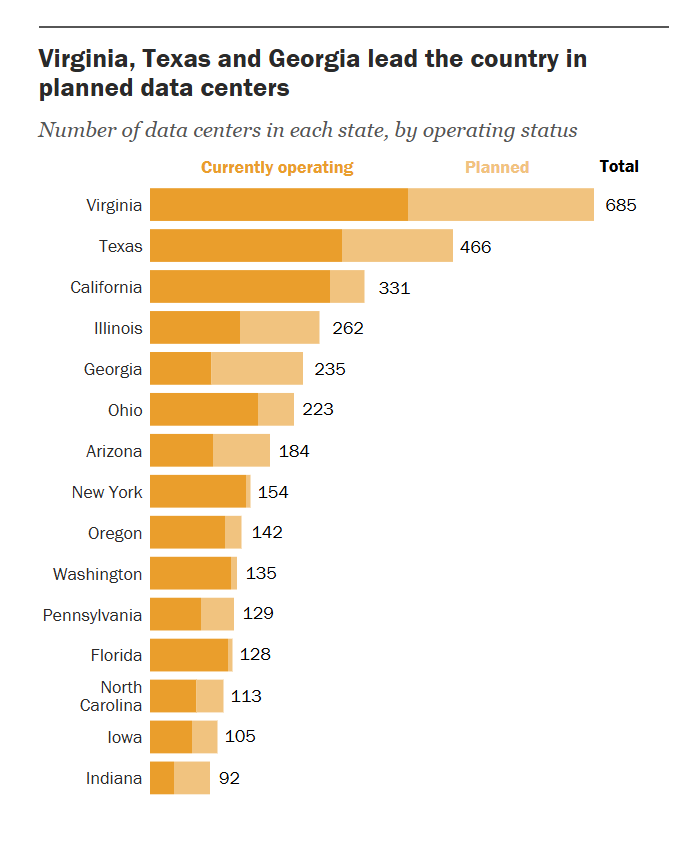
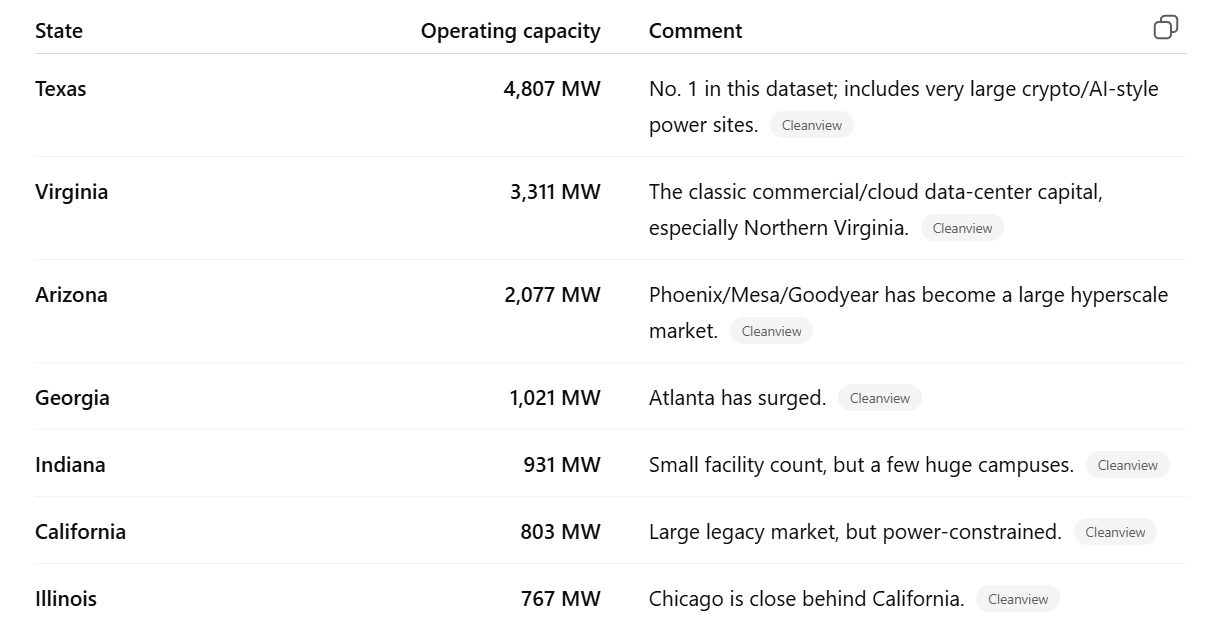
The chart does a simple count, but because new data centers are much larger than ones built 20 or 30 years ago, California’s #3 position is misleading. ChatGPT says that California is a “legacy market” that has already been reduced to irrelevance:
If the shooters hadn’t killed themselves, in other words, they might have grown up to receive a state transfer of some wealth earned by Jensen Huang, but otherwise it is tough to see what connection or common cause they might have had with Jensen Huang or anyone else at NVIDIA. Same deal with the victim. Amin Abdullah, the security guard who perished in the attack, was a Muslim who worked at a mosque and was a father of eight children. What was his shared cultural or religious connection to a childless atheist working at a tech company and spending weekends at Pride events in San Francisco?
Note that with our asylum-based immigration system, I don’t think that the rest of the U.S. is far behind California in terms of being a random assemblage of humans with nothing in common. By design, the only thing that asylum-seekers have in common is that they didn’t like where they used to live. But California is a little ahead of the national trend.
Full post, including comments