This morning we got another absurd inflation number from the BLS (3.7%/year). As harped on numerous times here, headline inflation is untethered to actual costs in the U.S. partly because of the Owners’ Equivalent Rent scam. There’s a recent beautiful example of this in our own Florida neighborhood (Abacoa, within Jupiter, which is within Palm Beach County).
The house recently sold for $3.1 million and will, I’m sure, cost the new owners another $3.1 million in property tax, maintenance, insurance, landscaping, pool care, etc. over the years. What would an owner tell the BLS about what he or she thinks it would cost to rent? Perhaps the Zillow number of $8,593 per month. That’s about half of what an interest-only 30-year mortgage on the place would cost, if a 30-year interest-only mortgage were available. It might be 20% of the real cost of living in the house as an owner.
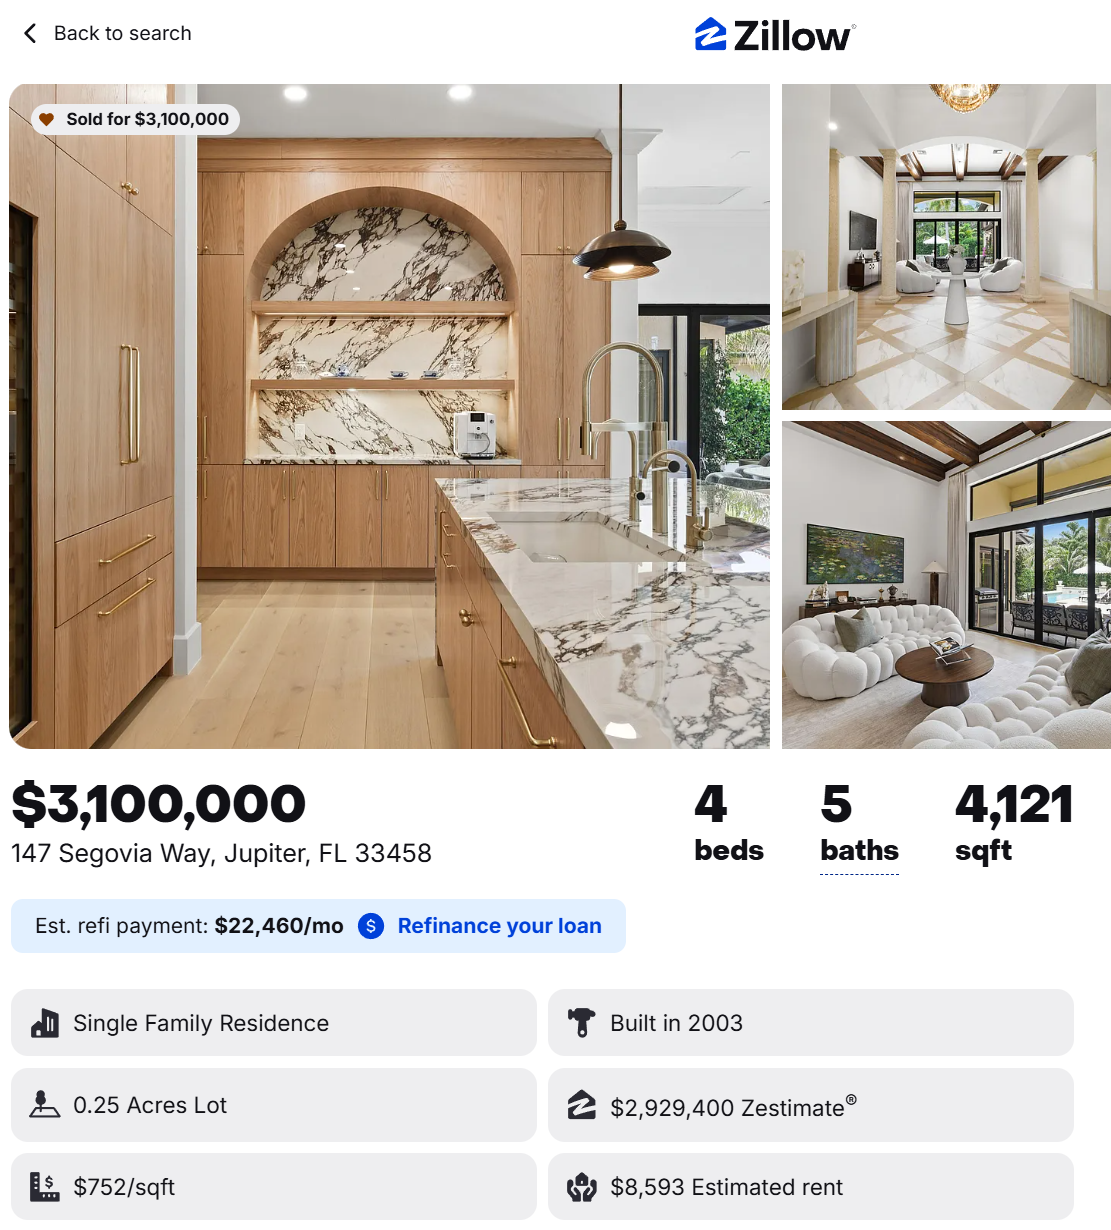
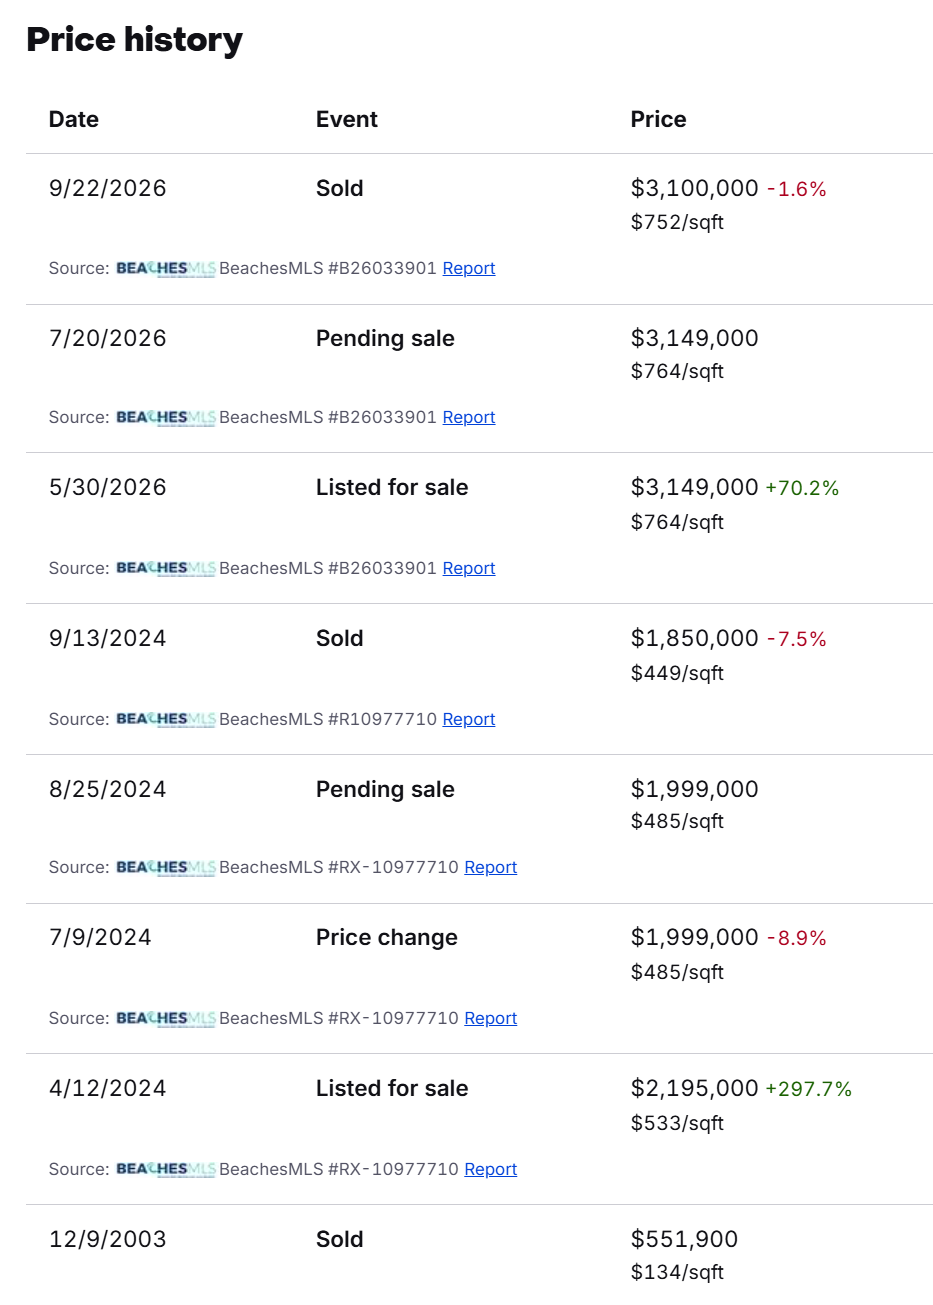
Note that this is pretty much the top of the Abacoa market. The owners apparently bought it, invested a ton of money in renovation (though it was not taken back to the studs nor was the room layout changed), and then decided that they were too rich to live in a $3.1 million house.
Here’s the complete price history:
Only 4,121 sqft, barely any backyard, no waterfront view, next door neighbors practically sitting in your living room, and I don’t even see a garage! All for just $3.1 million? What an absolute bargain!
There’s a two-car garage, which at best is a one-car garage because there is no basement and, therefore, the garage must be used for storage of trash barrels, bicycles, etc.
I’d never get my brother-in-law and his 6 kids and wife out of the guest house. I couldn’t even afford the interest on borrowing the $35K property tax every year.
The NPR had a story on that said it was going to cost around $1000/sq. ft. to rebuild (back to sub-luxury grade) in L.A. after the fires. Yeah, George, this a bargain at $800/sq. ft.!
“Welcome to one of the most extraordinary homes ever offered in Valencia at Abacoa.” I’d argue that Phil’s will retake that distinction when he sells. Which other home in Abacoa has been thoughtfully reimagined, from roof to audio/visual to pool to master bath fixtures, by a famous engineer (extraordinaire) with a Ph.D. from MIT?
Typical for housing corrections, booming above $3M & crashing below $1M. Would gather team Greenspun is all cash based, immune to interest rates, while the sub $1M club is all credit based & vulnerable to interest rates. The plebeians are getting another .25% hike in 2 weeks.
All cash-based? We got a 100% mortgage on our house at 3.125%. Locked it in February 2022 and closed on the house in April 2022 when interest rates were already rising dramatically. First mortgage and first smart financial move that I’ve ever made! I can thank Biden and taxation for this move. I would have sold stocks acquired 20 years earlier to pay for the house, but was stopped by the prospect of (1) paying capital gains tax on inflation-driven fictitious gains, and (2) having the money spent by Joe and Kamala.
Our house hasn’t gone up that much, of course, but leaving the money in the S&P 500 was inadvertently a very good investment!
I asked Claude how many golf courses are near this property:
Abacoa Golf Club, Trump National Jupiter, Bear’s Club, Admirals Cove, Loxahatchee Club, Golf Club of Jupiter, Jonathan’s Landing, Old Palm, Old Marsh, Jupiter Dunes, Seminole, Mirasol, BallenIsles, Jupiter Country Club, Frenchman’s Creek, Frenchman’s Reserve, Eastpointe, Dye Preserve
That’s 18. I left out the two borderline clubs at about 5 miles, Lost Tree Club and PGA National. If you want those too, the count is 20.
Phil, the $3.1m home in your neighborhood does not reflect the median home in the U.S., where prices are in the ~$400k range (depending on data source). Median prices aren’t up that much in the past year and price increases have been lower than overall total CPI. Median U.S. home prices were up as follows for the most recent data points by each provider:
National Association of Realtors: +1.3% YoY in September.
FHFA House Price Index +2.1% YoY in 2Q26.
S&P Case Schiller National Home Price Index: +1.9% in July.
MHP: Given the rise in interest rates since 2021, wouldn’t it be fair to say that the price of a house, even one whose purchase price hasn’t budged, is up at least 50%? What most people pay is a monthly mortgage. Not to mention that all of the costs associated with owning a house (insurance, maintenance, property taxes, etc.) have done up since 2021 in most parts of the U.S., right?
The Google says that the 30-year mortgage rate was 6.2% a year ago vs. 7.5% today. Gemini (sticking with The Google) says that the result of this is a 14% rise in the monthly payment on a 30-year mortgage with everything else held constant. So the house that has gone up 0% in price has actually gone up at least 14% in cost!
Phil, the data (from NAR) show the median home price has increased at a 3.8% CAGR since 2021. And, yes everything else is up a lot…Bidenflation!
OER is simply based on rental prices (which econ 101 tells us will correlate with the underlying home price). To calculate OER, the government statisticians simply ask a bunch of homeowners how much they rent their home for. Yes, as with any statistical data there are always lots of considerations.
As a check on OER, you could also look at reported rental prices from non-governmental sources, which also show relatively modest changes over the past year (and one is actually down YoY):
Zillow: +2.7%
Apartments.com: +1.5%
Apartment List: negative .4%
MHP: But asking homeowners what their house would rent for makes no sense in a market where houses aren’t generally rented. No for-profit enterprise has ever offered to buy up a lot of houses in our neighborhood for the purpose of renting them out, for example, which tells you that it doesn’t make any financial sense to be a single-family-home landlord here. Cars are more often rented, but if a BLS surveyor came and asked me “What would your 2021 Honda Odyssey rent for if you were in the business of renting out old/kid-trashed minivans?” I don’t think that I would be able to come up with an accurate number.
Phil, the single-family rental market is actually pretty large at ~14-15m units (~16-18% of total), so there are lots of owners that can be surveyed for the OER calculation. Also, in the past 20 years (mainly following the 2007-2009 financial/housing crisis), a number of large institutional players began purchasing single-family homes and renting them (as a business). These players expanded the market significantly. Among the larger players: Progress Residential, Invitation Homes (trades on NYSE: INVH), American Home (trades on NYSE: AMH), FirstKey Homes, Amherst/Main Street Renewal, Tricon Residential (owned by Blackstone).
Sure. But the BLS doesn’t just go to Blackstone and ask how much rents went up. Instead, they call my 90 year old mom, and ask her how much her 800k house would rent for. And she says “I’m not sure – a lot I guess. Probably 250 dollars a month”.
That is higher than I would have guessed. Still, As Anon points out, the average homeowner in the average neighborhood isn’t plugged into this market. Our neighborhood of 136 houses doesn’t have a single long-term rental as far as I know. The Zillow rent estimate might be accurate because it could be based on what’s happening in other neighborhoods nearby, but, as noted above, it would be financial suicide for the landlord.
Phil and anon, for the OER calculation, the BLS only samples homes that are being rented. So, unless your mom is renting a home, she would not be surveyed or included in the statistics, and likewise folks in Phil’s neighborhood would not be surveyed because as he says none are renting their homes. The survey only includes people who are “plugged in” on the single-family rental market.
MHP: Are you sure about that? How would it make sense to ask someone to estimate the rent of a house that actually is being rented? In that case, wouldn’t it be simpler for all concerned to write down the actual rent rather than an estimate?
https://www.bls.gov/cpi/factsheets/owners-equivalent-rent-and-rent.htm
says “OER is based on the following question that the CE Survey asks of consumers who own their primary residence: “If someone were to rent your home today, how much do you think it would rent for monthly, unfurnished and without utilities?””
If they didn’t do this, or ask owners of owner-occupied housing how much they were actually spending, CPI wouldn’t include any data at all regarding owner-occupied housing, which is about 65% of housing in the U.S.
(It actually is a little tough to figure out what should be included. Should inflation measure the cost of buying a house in 2026 and living in it going forward (for anyone with a mortgage, dramatically more than in 2025 due to interest rate increases)? Or should it measure the cost of having purchased a home six years ago and continuing to occupy it? In this latter case, set at half the median tenure of 12 years, the mortgage price stays the same in nominal dollars, but utilities, maintenance, insurance, property tax, etc. can go up or down.)
Phil, if you look at the link you included, the portion you referenced is for *owner* occupied units and is used to derive the “expenditure weights” market basket.
Just following that section, they describe the question they ask of *renter* occupied units that is used to derive the expenditure weight for *rent* (it isn’t an estimate, it’s what the actual renter is paying for the home):
>>”What was your total rental payment for this month for this unit? Include any extra charges for garage or parking facilities, but do not include direct payments by local, state or federal agencies.”
Phil, your point that it’s “actually a little bit difficult to figure what should be included” is a good one, particularly if we add mortgage debt into the mix since most homes are purchased with a mortgage.
1) Mortgage rates obviously impact housing prices, but often with a lag (home prices are sticky).
2) Mortgages obviously impact the decision of a homeowner whether to sell and move if they have a super low mortgage on their existing home (“lock in”).
3) Even if home prices don’t change much over a year, if mortgage rates surge (as they have in the past 12 months), this results in a dramatically higher cost of purchasing a new home (“inflation” in cost of owning a new home or moving).
Actual single family $1M single i Abacoa can be rented at about $6,500
https://www.zillow.com/homedetails/108-Canterbury-Pl-Jupiter-FL-33458/103472053_zpid/
That’s a huge loss to the owner, Ivan! Gemini says that the monthly payment for borrowing $1 million at 7.5% would be $7000 per month. The landlord would lose money even if he or she got insurance, property tax, maintenance, landscaping, pest control, pool service, etc. for free!
That’s assuming the landlord bought today. But he bought 16 years ago at $398,000.
Sure, he would have been probably better off just selling instead.
Oh, I see that now. Maybe there is some long-term plan and the rental is a temporary expedient? Of course, most temporary expedients end up being close to permanent!
Phil, in reading your comments, I get what you are saying about your neighbor’s $3.1m home and your other comments on inability to cover a mortgage on another $1m home, but the following may help in understanding what is going on with those very high-end homes vs. the median home selling for ~$400k. The markets for these expensive homes and the median home are very different. For purposes of looking at inflation in rent/shelter, probably better to look at the median #s that are referenced in several comments. From Grok:
Rents do not scale linearly with prices. The amount people will pay to own a home (for control, customization, status, long-term security, or tax treatment of a primary residence) rises faster than the amount they will pay to rent an equivalent one. High-end buyers often treat the property more as a consumption good or lifestyle asset than a pure cash-flow investment. Potential renters for multi-million-dollar homes form a much smaller pool, limiting how high rents can go relative to values.
Higher land-value share in expensive properties. Cheaper homes often have a larger fraction of their value in the depreciable structure (the part that more directly generates rental “services”). Expensive homes frequently sit on costly land in desirable locations; land itself produces less incremental rental income relative to its price, compressing yields while supporting stronger long-term appreciation expectations.
Different expected returns composition. Across cities, lower-price tiers tend to deliver higher rental yields but lower house-price appreciation; higher-price tiers show the reverse. Total returns (yield + appreciation) often roughly equalize over long periods. Within cities the picture can differ, with lower tiers sometimes showing both higher yields and solid appreciation (e.g., via gentrification). Investors in expensive segments accept thinner current yields partly because they anticipate stronger capital gains or other non-cash benefits.
Market segmentation, credit constraints, and risk. Affordable segments face stronger, more inelastic rental demand from households who are credit-constrained and cannot easily buy. Higher-end markets attract more institutional or wealthy capital willing to pay up for perceived quality, safety, or scarcity, which compresses cap rates/yields (analogous to how investment-grade bonds yield less than higher-risk ones). Maintenance, vacancy, and operating costs also scale differently and can further reduce net yields at the top.
In short, expensive homes look “discounted” on a pure rent-to-price basis because their prices embed larger ownership premiums, land values, and appreciation expectations that renters are less willing (or able) to pay for. The pattern is a durable feature of housing markets rather than a temporary anomaly.