A friend in Holland in is his 60s and therefore beginning to enter the real risk window for COVID-19. When I call to check on him, he is usually out in the busy square of his university town. “Some students just walked by with six crates of beer,” he remarked. Holland never truly shut down. Unlike Sweden, however, the schools closed. “The teachers are unionized,” my friend said. “So they knew they’d get paid whether or not they went to work. Of course they immediately refused to work and said that the schools had to be closed in the name of protecting everyone.” How about the stores? “Everything is open except for the red light district,” he responded. (If the gals working there could somehow make it to Boston, they could earn a lot more than they’d been getting in Amsterdam!)
(How’s Holland doing? The Population is 17 million. As of April 9, they’d suffered 2,248 deaths compared to 10,853 in France, population 67 million. I.e., the Netherlands has had a lower death rate than France. France began locking down on March 13.)
If people making the decisions on shutting down continue to get paid, when would they ever suggest reopening? Who is involved in or has influenced decision-making in the U.S. on this issue?
One thing the above folks all have in common: they will still have the same job at the same pay regardless of the length of the shutdown. What’s their lockdown experience like? I was on FaceTime yesterday with a (flying friend) professor of “science and public policy,” i.e., exactly the kind of person whom a government might turn to for advice. He is suffering through the lockdown at a 20-acre family property right on the ocean.
If your job is engineering or manufacturing widgets, on the other hand, every additional day of shutdown is additional risk that a customer will decide to buy widgets from Korean, Japanese, Taiwanese, or Chinese suppliers that remain up and running. You will come back after the shutdown to reduced revenue and a much tougher competitive environment in direct proportion to the length of the shutdown.
Given that even one death is one death too many from COVID-19 and that we should always act out of an abundance of caution and that we assume that our shutdown has had a tremendous life-saving effect, when would folks who are immune to any negative effects of economic/societal shutdown ever decide that it is time to reopen?
While the rank-and-file righteous were posting on Facebook their hopes for continued exponential growth through November in American deaths, journalists were publishing their hopes for dramatic near-term exponential growth in Swedish deaths. As infidels against the religion of “saving lives” via social and economic shutdown, the Swedes deserve to experience the full wrath of the coronavirus god:
After 8 days of unimpeded exponential growth since that April 4 article, how many thousands of deaths did 10 million Swedes experience in the last 24-hour period, according to the WHO? 17. Seventeen thousand? No: 17. Locked-down Denmark, with a population size half of Sweden’s, had 13.
4/12 comment: Sweden has 466 new cases; locked-down Denmark has 177. Sweden suffered 17 deaths; Denmark 13. I.e., adjusted for its 2X population, wide-open Sweden has a higher rate of new cases and a lower rate of deaths. Massachusetts has gone off the rails compared to Sweden. With 2,615 new cases, Massachusetts has 8X the new case rate of Sweden’s. With 70 deaths, locked-down Massachusetts has 6X the death rate of Sweden.
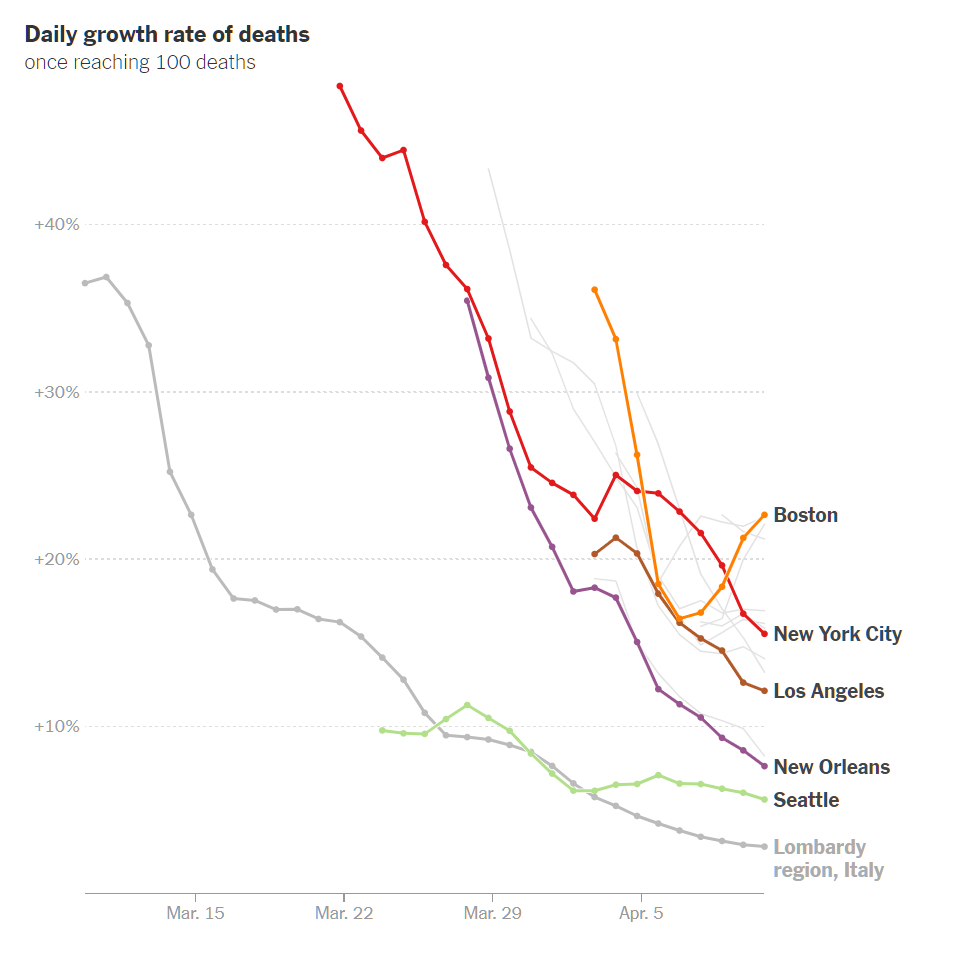
In other words, the exponential doom forecast for schools-/restaurants-open Sweden has actually happened, but to schools-/restaurants-/offices-closed Massachusetts. The University of Washington prophets are still showing that Massachusetts will suffer a higher death rate, adjusted for population, than New York (though Sweden’s death rate will be yet worse, say these lockdown advocates, roughly twice as high as New York’s).
Graphic from today’s NYT:
Separately, I still think it is an open question as to whether the number of worldwide new cases of COVID-19 is declining. Testing continues to ramp up, but the number of new cases is only 17 percent higher than it was on April 1.
Certainly the Swedish numbers will not convince Americans who bought into the shutdown religion, any more than a high death rate during the Black Plague sowed doubt in the minds of the Flagellants (if half the people in a town were killed, the Flagellants would say “if we hadn’t whipped ourselves, the death rate would have been nearly 100 percent”!).
[Separately, a friend asked privately “What is your ultimate Sweden prediction? It is nice we actually have a control that rational people can look on.” So that I can’t go back on this and deny him the opportunity to ridicule me later, I will put my answer here. Massachusetts and Sweden are fairly comparable in terms of percentage of the population that live in an urban area. Sweden’s population has a slightly older median age, but, perhaps healthier so that’s a wash. My prediction is based on the Massachusetts “curve flattening” efforts, including shutting down schools, restaurants, and offices, saving zero lives compared to Sweden’s shutting down mass gatherings. Neither Sweden nor Massachusetts will run out of health system capacity and therefore every patient will get whatever medical interventions are available. Sweden spends 11 percent of a lower per capita GDP on health care versus 17 percent here in the U.S., but our incompetence could easily soak up the difference in spending and therefore the systems should be equally effective (actually equally ineffective would be more accurate right now due to the lack of any drug or procedure that seriously impedes the virus). The American system will not let anyone die, regardless of how many organ systems are destroyed, so long as Medicare can still be billed, and this will be the basis of a differential. My prediction is that Sweden’s death rate from COVID-19 for all of 2020 will be 1.15X the Massachusetts rate.
(Where are they right now? Sweden has 887 deaths, or 90 per million inhabitants. Massachusetts has suffered 756 deaths so far, roughly 110 per million.)
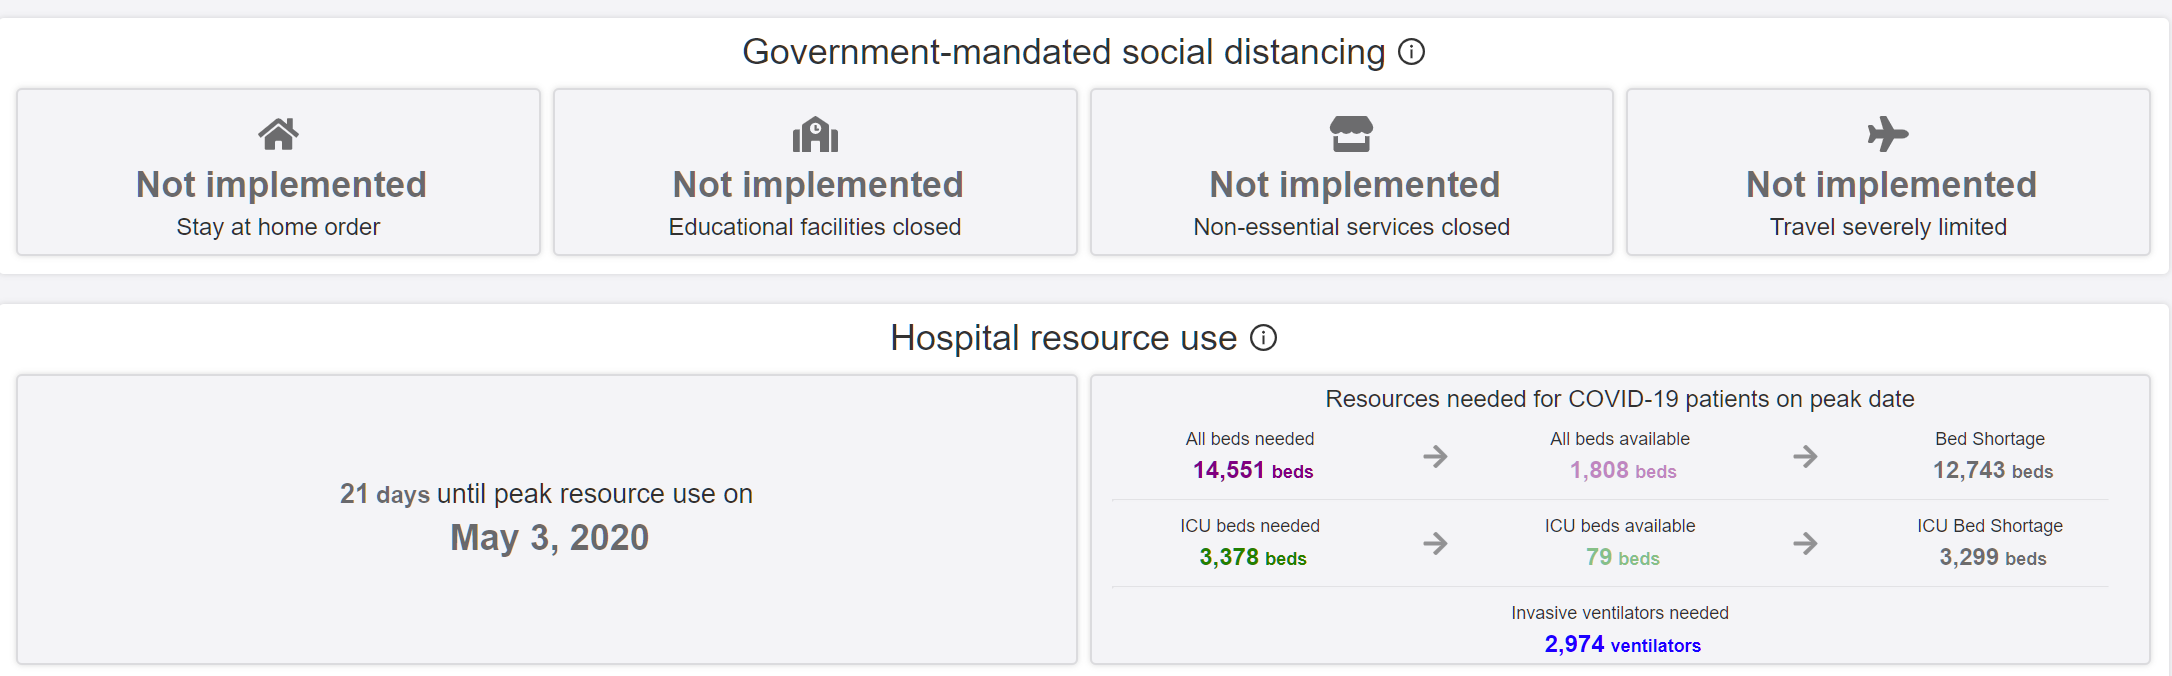
As long as we’re making predictions, what about the total for Massachusetts and Sweden? The University of Washington right now says that doom is in store for Sweden. They’ll have 13,259 deaths through August 4, 2020. They’ll have 79 ICU beds and need 3,378(!).
Shut-down Massachusetts is forecast to suffer 6,739 deaths through August 4, 2020, out of a total U.S. death toll of 61.545. I.e., with 2% of the nation’s population, we will have 10% of the COVID-19 fatalities. This seems like too large a share, even for a population that spends most of its time reflecting with satisfaction on how stupid people in the south and Midwest are (imagine if we’d put that effort into stockpiling masks and coming up with a plan for a flu-like epidemic!). So let’s cut this back to 7% of the U.S. fatalities: 4,300 (if we believe the 61,545 prophecy). This implies that Sweden will lose 5,000 citizens by August 4, 2020. I have much less confidence in these numbers than in the idea that the death rates in Sweden and Massachusetts will be within 20% of each other.]
Update 4/14: The latest report for Sweden: 465 new cases and 20 deaths (Denmark was at 144 and 12). Massachusetts had 1,296 new cases and 113 deaths (8X the death rate).
An attempt to calculate Rt, the effective reproduction number, in each state: Which states have the epidemic least “under control?” To answer this, I plotted states where the best case (eg. low end of HDI) is above 1.0, indicating the true value of Rt is almost certainly above 1.0. Surprisingly, Rhode Island, Maryland and Massachusetts sit at the top. Part of this may be that Rhode Island is earlier in its infection curve, but seeing large states like Massachusetts and Texas above 1.0 is worrisome —especially because none of these states have hit the headlines as being trouble spots.
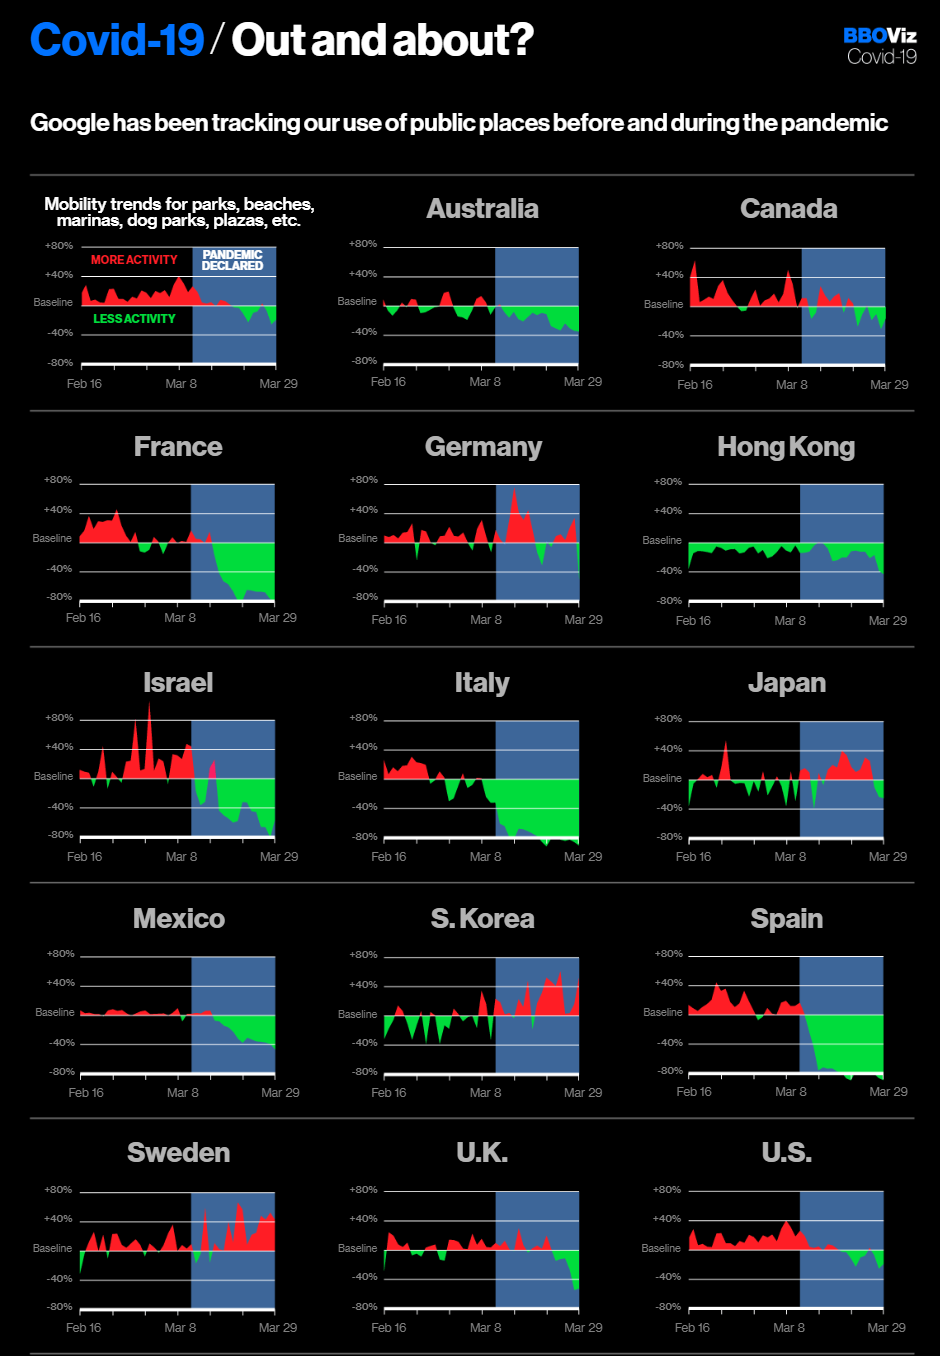
“Some Countries Are Taking Social Distancing More Seriously Than Others” (Bloomberg) contains some fascinating data collected by Google. They can figure out whether or not people in any given country are naughty (not socially distant) or nice (socially distant): “In Italy, public places are a lot quieter than before the spread of coronavirus. In Sweden, they’re busier.”
Google and the journalist/editors, of course, assume that more socially distant = more righteous. More social is depicted in red and less social is depicted in green.
Sweden is just packed with covidiots milling about together and transmitting the lethal virus! But also Germany, supposedly shut down. Americans heeded the call to take to their sofas. We love to consider ourselves superior to Mexicans. And every Hollywood Democrat wants to escape Trump via emigration to Canada, not Mexico, but Mexicans have changed their behavior far more than Americans or Canadians.
Is everyone sick of seeing friends and co-workers compressed into a portion of an already-small monitor?
The only good video conference experience that I have had was back in 2000 in Australia. A university with two campuses used the rear wall of a lecture room as a life-size window into a room that was about 20 miles away. People in that remote room appeared life size on the rear wall. The data link speed was, I’m sure, nowhere near as good as the standard fiber-to-the-home services today. The projectors could not have been as good as today’s projectors. But it was surprisingly natural to converse with people who seemed to be just on the other side of the wall.
Multi-city law firms today often have advanced systems. A huge direct-view TV (85″?) on one wall of the room in New York can show what is going on in a similar room in D.C. It doesn’t seem as effective as the system that the Australians had back in 2000, though, because the people who appear on the screen are not as big as the people who are live in the room (or as “live” as anyone can be who is working on a patent infringement question!).
Back in 2003, I wrote up an idea for a infrastructure that would enable a person to work side-by-side with an assistant in another part of the world: “it is as if a wall in one’s office is opened up to the assistant’s office thousands of miles away”. Why not build home offices like this as standard? A window in front and video walls left and right. If the plague returns, everyone who currently works side-by-side in a Silicon Valley coding plantation can go home and still work side-by-side with at least two co-workers at a time.
I’ll cut and paste the research idea from 2003…
Americans make expensive employees. Productivity is measured as economic output per dollar of labor input. In the absence of technological advances, the only way to improve labor productivity is to move the job to a low-wage country. Pairing every American office worker with an assistant in a low-wage English-speaking country (or a low-wage part of the US) would be an excellent way of boosting productivity without exporting jobs, assuming that an effective coordination system can be constructed.
The Labus Novus coordination system will comprise the following components:
a life-sized two-way video conferencing system; it is as if a wall in one’s office is opened up to the assistant’s office thousands of miles away
an information system that records everything relevant to the high-wage worker’s job, including facts, reference material, contacts, correspondence, appointments, and relationships among these items [like a more sophisticated Microsoft Outlook]
robot arms and other robots within the high-wage worker’s office that can be manipulated by the low-wage worker, thus enabling the assistant to pull folders from file cabinets, position papers on a desk, etc., from the other side of the planet
Current state-of-the-art video conferencing systems require 6 Mbits of point-to-point bandwidth. Thus the requirement of extremely high quality video conferencing implies the need for research in video analysis and compression, network protocols and routing, and semiconductors and optics for very bright images.
[Ooops! This is rather unfortunate to read, 17 years later! 6 Mbits?!?]
Outlook-on-steroids might sound straightforward but doing the job right can be as challenging as all of Artificial Intelligence. We are building support for a computer-mediated assistant rather than attempting to build a fully automated personal cognitive assistant. This does not reduce the difficulty of achieving a complete solution but it does increase the utility of an incomplete solution.
A desire to give the assistant the ability to manipulate physical objects half a world away (telepresence) justifies research in broad areas of robotic actuators and sensors.
Funding Possibilities: Phone companies are logical sponsors for this research. Telcos built a tremendous amount of network capacity in the 1990s but then neglected to offer any services besides voice communication, thus resulting in falling prices and bankruptcies. Only about 10 percent of the fiber installed through the U.S. is actually being used. Continuously active high quality video conferences have the potential to consume all of currently unused bandwidth in the networks.
Note that the system could be used domestically, yoking together a worker in an expensive crowded place such as New York City with an assistant in a low-wage uncrowded place such as Iowa.
How did the U.S., which spends 17 percent of GDP on health care, corresponding to every American working one day per week to pay for health care, manage to run out of capacity from a bad season of a flu-like illness?
Part of the answer is that the U.S. was never in any danger of running out of hospital capacity as a result of coronavirus, even if we had pursued a Swedish-style policy (schools, restaurants, offices open; mass gatherings shut). We have had some overcrowded hospitals, yes, but they were in all cases only a short drive away from some uncrowded hospitals. If people could wait for hours in the ED, as most did, they could easily have survived a 30-minute or 3-hour bus ride (with a nurse and maybe some oxygen bottles) to an uncrowded hospital.
See “Monroe County hospitals prepare for coronavirus ‘surge’” for example. As of March 27, when New York City was already turning into Wuhan-on-the-Hudson and three days before the USNS Comfort arrived, 33 people were hospitalized in the Rochester, NY area, which has nearly 2,000 hospital beds on a normal day as part of its state-of-the-art hospital system and top-ranked medical school. Compare to this March 25 NYT article, about patients waiting almost 60 hours for a bed at a Queens hospital. It is a 5.5-hour bus ride to Rochester. If everyone at the Queens hospital who didn’t need immediate attention had been sent to Rochester, each patient could have received personal attention from an unstressed team of physicians and nurses.
See also “During a Pandemic, an Unanticipated Problem: Out-of-Work Health Workers; Across the country, plunging revenues from canceled nonemergency medical appointments have forced hospitals to furlough or cut the pay of doctors, nurses and other staff.” (nytimes) In other words, the typical American hospital is mostly empty of both patients and staff!
New York spends $88 billion per year on its Department of Health, but apparently has put no thought into load balancing. A friend who has worked in this industry: “People in government don’t want to do anything at all until there is a disaster. Once the disaster hits, they don’t want to do anything that they haven’t already done.”
The way that the U.S. has handled coronavirus so far combines the worst features of a megasystem (huge bureaucratic costs and long bureaucratic delays) and the worst features of a small island health care system (people must be treated at the single hospital that is closest to their home).
Could it be that the most important thing we can do to prepare for the next flu-like epidemic (which might just be the next outbreak of coronavirus?) is to have some buses ready with spacious recliner chairs and oxygen bottle holders next to each chair? (Argentina already has “business class” buses like this for inter-city transport, minus the oxygen bottle holders!) Combine this with a Florida-style system for tracking hospital capacity in near real-time and we can surely expand the U.S. capability of handling epidemics by a factor of 5-10.
“Mayo Clinic announces sweeping pay cuts, furloughs” (MPR), from the nation’s most successful (outcomes) hospital: The state’s largest private employer is instituting across the board pay cuts and furloughs to shoulder a projected $3 billion loss this year. “The decision to eliminate elective surgeries and outpatient visits was the right decision in terms of protecting the safety of our patients and staff, and also preserving limited PPE (personal protective equipment),” said Chief Administrative Officer Jeff Bolton. “But it has led to significant reductions in revenues.” Bolton said the hospital in Rochester is at about 35 percent of capacity, while capacity in Mayo’s surgery services is at about 25 percent. “If you go back to the Great Depression, the institution went through a very similar financial crisis, and salaries were reduced during that period of time,” said Bolton. “There were a lot of actions that were very similar to the ones we are taking today.”
Results show that the doubling time early in the epidemic in Wuhan was 2.3–3.3 days. Assuming a serial interval of 6–9 days, we calculated a median R0 value of 5.7 (95% CI 3.8–8.9).
In “Full range of coronaplague opinions” (March 25), I first noted that a team at Oxford led by Sunetra Gupta conjectured that as many as half of Britons were already infected with coronavirus due to the high R0. If the conjecture were true, it would invalidate the recommendations of the Imperial College study that led to a Western rich-country shutdown (except for Sweden). (No point in shutting down a society/economy to reduce transmission of a disease if the disease has already reached most people.)
Can we believe this spectacular R0 number? It is lower than measles (12-18 without vaccinations). But such a high value seems inconsistent with the success of various Asian countries that have suppressed COVID-19.
Note that the authors of the new paper are huge fans of government and public health interventions:
Our results suggest that a combination of control measures, including early and active surveillance, quarantine, and especially strong social distancing efforts, are needed to slow down or stop the spread of the virus. If these measures are not implemented early and strongly, the virus has the potential to spread rapidly and infect a large fraction of the population, overwhelming healthcare systems.
But if they are right about R0, it is unclear how these could work in the U.S. once the economy and society are reopened. Consider a single infected traveler to an uninfected region of the U.S. A week after a visit to a business convention or a theatrical performance there could be more than 300 cases (45 infected at the first event, as with the choir practice in Washington; doubling to 90 after 2.5 days; doubling to 180 after 5 days; doubling to 360 after 7.5 days).
Also, if they’re right about R0, it is way too late for Sweden to do anything to change its trajectory. Our media are desperate for Swedes to die (today: “Sweden’s Relaxed Approach to the Coronavirus Could Already Be Backfiring” (TIME)), but since they didn’t shut down weeks ago the virus has to be pretty much everywhere by now. There wouldn’t be any point to Sweden falling in line with the sober non-science-denying governments.
[Note that Sweden’s new case rate is lower than Massachusetts and the death toll is similar on a population-adjusted basis (10 million for Sweden; 7 million for Massachusetts). The current University of Washington deadpool forecast is 5,625 for MA and just 4,182 for Sweden (i.e., shut-down MA will see substantially more deaths per 1,000 residents than open-for-school-and-work Sweden). Somehow the deaths of thousands of Massachusetts residents after dramatic government school and business closures is not interesting. (I’m keeping the numbers up to date in this older post.)]
Why can’t we do a test of the general population? “Coronavirus may have reached Colorado as early as January” (Colorado Sun) If R0 is, in fact, 5.7, shouldn’t everyone in Colorado who is going to develop symptoms already have developed them? (The U Washington deadpool says that Colorado peaked yesterday for hospital utilization.)
Doing a super crude calculation, in which the doubling time stays constant, we take the base 2 log of Colorado’s population of 5.6 million. From a single infected person showing up, it takes just over 22 doublings for everyone to be infected. If the doubling time is 2.5 days, that’s 55 days (i.e., if the first infected person arrived in mid-January and the doubling time lengthened gradually (due to a lot of people already being infected), the 100-percent infected time would be right around now).
Or maybe a single R0 number is not that useful. R0 is high in China and U.S. urban mass transit environments such as New York and Boston, but much lower in sprawling car-dependent environments (e.g., Denver)?
A friend has escaped with his family to Mount Desert Island, home of Acadia National Park and quiet summer playground of the rich (notably the Rockefellers). The airport was busy for a time pumping Jet A into the Gulfstreams that were dropping off elite New Yorkers fleeing Wuhan-on-the-Hudson.
If the state-by-state model is correct, those who fled to Maine made a wise choice. The state is not forecast to run out of either hospital or ICU beds (neither are neighboring New Hampshire or Vermont).
It looks as though the trails of Acadia are still open, even if the park roads and carriage roads are closed. The governor has issued a “stay at home” order, but the local sheriff says:
First and foremost, lets quash some rumors out of the gate. There are absolutely, positively NO plans to participate in random motor vehicle stops and/or check points to actively look for and arrest violators of the Governor’s order. Although this an order issued by the Governor, you retain your constitutional rights and we respect that. Please note, however, we are sworn to uphold the Constitution and laws of the State of Maine and, to that end, we are prepared to enforce the Governor’s order in the event of blatant and overtly defiant violations.
A Lamoine woman called the Hancock County Sheriff’s Office Monday with concerns she had about neighbors having more than 10 guests at a time at their residences despite Governor Janet Mills’ recommendation against such gatherings amid the coronavirus outbreak.
I wonder if these states break the model. As of 4/8, Vermont was supposed to have experienced peak resource demand on April 1. A total of 47 Vermonters will die, say the prophets. That’s out of a population of more than 625,000. The disease will never spread around Burlington, a reasonably dense urban environment that is packed with visitors? People who live in Southern New Hampshire often commute to plague-afflicted Boston for work. Yet the entire state is supposed to have only 66 deaths out of 1.35 million residents. The model assumes social distancing through May 2020, but the deaths are through August 4, 2020. If society reopens on June 1, won’t there be exponential growth in New Hampshire seeded from those who commute to Boston? (Even now, righteous Democrats are driving to Walmart and other places in New Hampshire so as to avoid paying sales tax here in the Land of Big Government.)
How do people in this lonely-yet-connected corner of New England escape COVID-19?
People often are drawn to computer nerdism partly because they prefer interacting with machines rather than with other people. (James Damore made this point while working at Google and learned that free speech is for Americans who don’t need to work!)
Yet the coder in a modern Bay Area software plantation is sandwiched tightly between two other galley slaves (how’s that for a mixed metaphor?). He or she has less personal space than a McDonald’s cashier.
How did it come to pass that people who went into programming because they could be alone with their beloved machines are now packed like sardines into densely populated coding plantations and, after hours, packed like ocean liner steerage passengers into shared apartments?
Will this office structure, ideal for fueling any future pandemic, be reconsidered once this first wave of coronaplague subsides? Or are Silicon Valley nerds being superproductive from their cramped shared apartments such that employers won’t mind sending them into work-from-home status as soon as there is a hint of a second wave of coronaplague or whatever comes next?
Also, since people under 50 are more or less invulnerable to COVID-19 and the big Silicon Valley employers won’t hire anyone over 35, why not reopen Facebook, Google, Apple, et al? The aren’t too many senior citizens in Silicon Valley, except for some rich folks who can afford rings of servants while they keep safe in the innermost ring of their Atherton mansions.
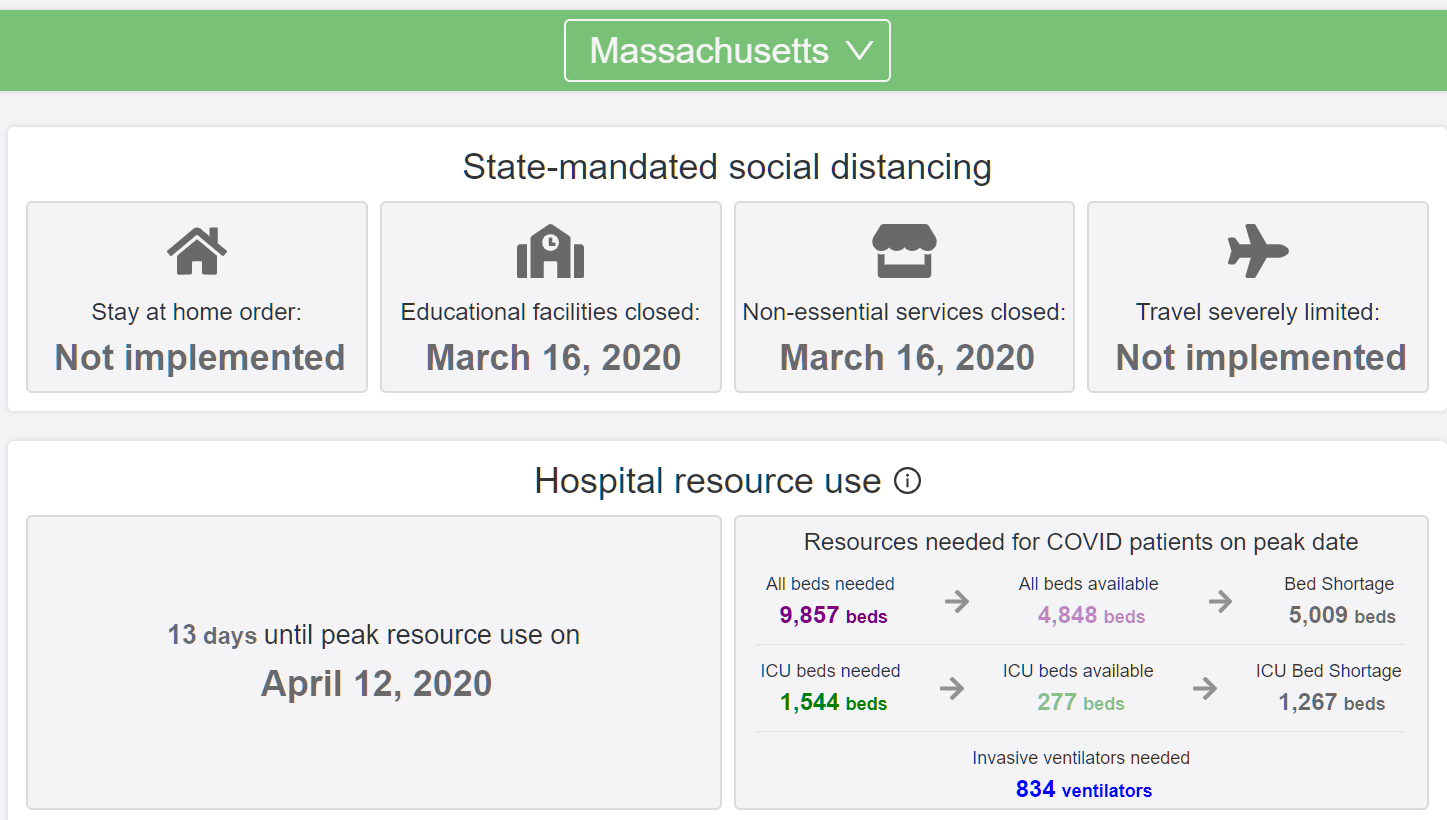
Back on March 29, we looked at the Massachusetts forecast for coronaplague. Science said that “Nearly as many people in Massachusetts will die as in Florida” (I forgot to write down the number) and that 3,300 Floridians would die. Massachusetts would suffer peak hospital use on April 12:
Science offers a much uglier prophecy today. Our peak is due on April 18, 2020 (another week of suffering and nail-biting). A shocking 8,254 of us will die (out of 7 million). That’s a higher per capita rate than what New York (15,618 deaths out of a population of 20 million) will suffer and more than Florida (forecast at 6,770). The forecast for the entire country remains roughly constant at 81,766. We have less than 10 percent of the ICU beds that we need and only about one third as many hospital beds. In other words, if you’re not crazy you’d be getting into a car right now and driving to Tennessee or Texas (both forecast to have few deaths per capita and no shortage of health care resources; Steve Jobs chose to get all of his cancer care in Memphis, ultimately).
Bad news:
Worse news:
One thing that is very odd is the counting of deaths. In “Number of new COVID-19 cases worldwide is declining now?” I link to the official state reports of deaths. The forecast says that there were “78 deaths per day” (actual) on April 5, 2020. The New York Times today says that we have suffered only 154 deaths total in the greater Boston area (includes southern NH); worldometers says 260 total deaths so far in Massachusetts (I have a tough time believe many are occurring outside of the greater Boston area). The latest report from the state, which includes some deaths from over the weekend (apparently there is a reporting lag) says 356 people have died thus far, so maybe the correct data are being fed into the model.
It doesn’t look as though the U.S. as a nation will run out of health care resources to supply every COVID-19 patient with whatever the state-of-the-art therapy is (i.e., not much that is useful right now). However, since there is no load-balancing system for sending patients to idle hospitals, even within a city or state, some places seem to be at risk of dire Fall of Saigon-style situations. Massachusetts appears to be one of the worst prepared states, on the same scale as New York, but without the military support of a field hospital or a hospital ship.
[What about our shutdown? We’ve closed our schools, restaurants, and stores (except for marijuana and liquor). What did that do for us? The model site forecasts 4,182 deaths for Sweden (population 10 million; not shut down) and 8,254 for Massachusetts (population 7 million; shut down). I.e., we’re almost 3X as likely to die while alone at home watching Netflix compared to a Swede who is out eating and drinking with his/her/zer/their friends.]
March 20, 2020 Facebook posting from a wealthy (via marriage) Democrat:
Civil liberties, covid-19,Trump, and November election on my mind.
Her friend responds:
As much as I want this whole Covid-19 thing to be over, my biggest fear is that it will abate and the stock market/economy will rebound in time for the November election and Trump will claim credit and be re-elected.
Clicking on the friend’s page reveals a late middle-age woman with a cat, no sign of a husband, birth in Massachusetts and residence in Vermont, a recently graduated son (let’s hope she sued for child support in Massachusetts, which is much more lucrative than suing in Vermont!). Googling her name brings up a LinkedIn page that says she has worked for the state government in Vermont since 1982.
How did other friends respond to the response?
original poster: “and the 1200/ month got eligible families will help him too. Grrr.”
female-named friend #2: “it’s so orchestrated too!”
male-named friend: “I share your fear of his being reelected; however, my greatest fear is clearly the immediate problem– the COVID-19 pandemic threatens the health of all Americans, and will quickly overwhelm our health care system.”
[On that last one: Not only are viruses smarter than humans, but there is a virus more evil than Trump himself?!?!]
I’ve also seen a lot of Facebook postings from Democrats enthused about what they hope will be differential death rate; the healthy brown virtuous Bernie supporters will sail through the coronaplague, while old white Republicans will be culled from the voting herd.
The most confusing and fascinating phenomenon is the continued stream of anti-Trump abuse being posted by Facebookers who live in New York and California. Sometimes they will say that Trump is intentionally trying to harm “blue states” (they got a letter from God on the subject of Trump’s intentions so they know what motivates him?). As Commander in Chief, Trump had the discretion to send the Navy’s two hospital ships anywhere in the world. If “all lives have equal value” and we’re right about the “science” (epidemiological prophecies), the most logical places to send the ships are Brazil and Sweden. Due to their failures to lockdown, science tells us that this is where unfettered exponential growth will occur. Or maybe to India or Africa, both of which are going to be short of hospital beds.
If Trump believes, unreasonably, that American lives have more value than non-American lives, he could easily have decided to send the ships to Florida and New Orleans, i.e., a swing state and a state that voted for him.
When I point this out to the New York and California-based Trump haters, they are not motivated to reduce their level of contempt and hatred. Trump is a “fool”, a “sociopath” (but not one smart enough to send the ships to a state where people might vote for him?), etc. One popular retort is that Trump does not have the authority to tell the ships where to go. The President is only Commander in Chief during wartime and this is not a war. Therefore, it is a mid-level Navy bureaucrat (the Trump haters can’t say which one, but they are confident that Trump does not a say) who made a technocratic decision to send the ships to LA and NYC (this does not make logical sense; California is not forecast to run out of hospital or ICU beds while Louisiana will run out of both).