Department of Extrapolation: Masks worked in a hospital…
… so they will definitely work in the general population.
“Universal Masking to Prevent SARS-CoV-2 Transmission—The Time Is Now” (JAMA) says masks worked in the hospital:
In the largest health care system in Massachusetts with more than 75 000 employees, in tandem with routine symptom screening and diagnostic testing of symptomatic HCWs for SARS-CoV-2 infection, leadership mandated a policy of universal masking for all HCWs as well as for all patients. The authors present data that prior to implementation of universal masking in late March 2020, new infections among HCWs with direct or indirect patient contact were increasing exponentially, from 0% to 21.3% (a mean increase of 1.16% per day). However, after the universal masking policy was in place, the proportion of symptomatic HCWs with positive test results steadily declined, from 14.7% to 11.5% (a mean decrease of 0.49% per day). Although not a randomized clinical trial, this study provides critically important data to emphasize that masking helps prevent transmission of SARS-CoV-2.
Therefore, masks will send coronaplague packing:
First, public health officials and leaders need to ensure that the public understands clearly when and how to wear cloth face coverings properly and continue building the evidence base for their effectiveness. Second, although cloth face coverings are generally well tolerated for short periods, with prolonged use they can be irritating or difficult for some people to breathe through, especially in hot or humid environments. Innovation is needed to extend their physical comfort and ease of use. Third, the public needs consistent, clear, and appealing messaging that normalizes community masking. At this critical juncture when COVID-19 is resurging, broad adoption of cloth face coverings is a civic duty, a small sacrifice reliant on a highly effective low-tech solution that can help turn the tide favorably in national and global efforts against COVID-19.
The apparent contradiction between the bold-faced portions is not addressed.
[Potential bad news for American Karens: “It is probably safe for individuals and safe for others to drive alone…without a face covering,” (see this instructional video)]
So… the Swedes and the World Health Organization (advice through early June) are wrong about masks for the general population being effective in reducing plague? How might we be disappointed a few months down the road if we rely on this article?
- In a hospital people don’t have any real choice about how far apart to stand (similar to public transport). So the donning of masks won’t lead people to change their “social distance” (risk compensation and see also “Why is Sweden still not asking people to wear face masks?”).
- Each hospital worker has been fitted for an N95 mask (choice of at least 6 different styles) by a professional fitter.
- Hospital workers dispose of the masks between patients or at the end of each day. Hospital workers have access to handwashing and hand sanitizer within a step or two.
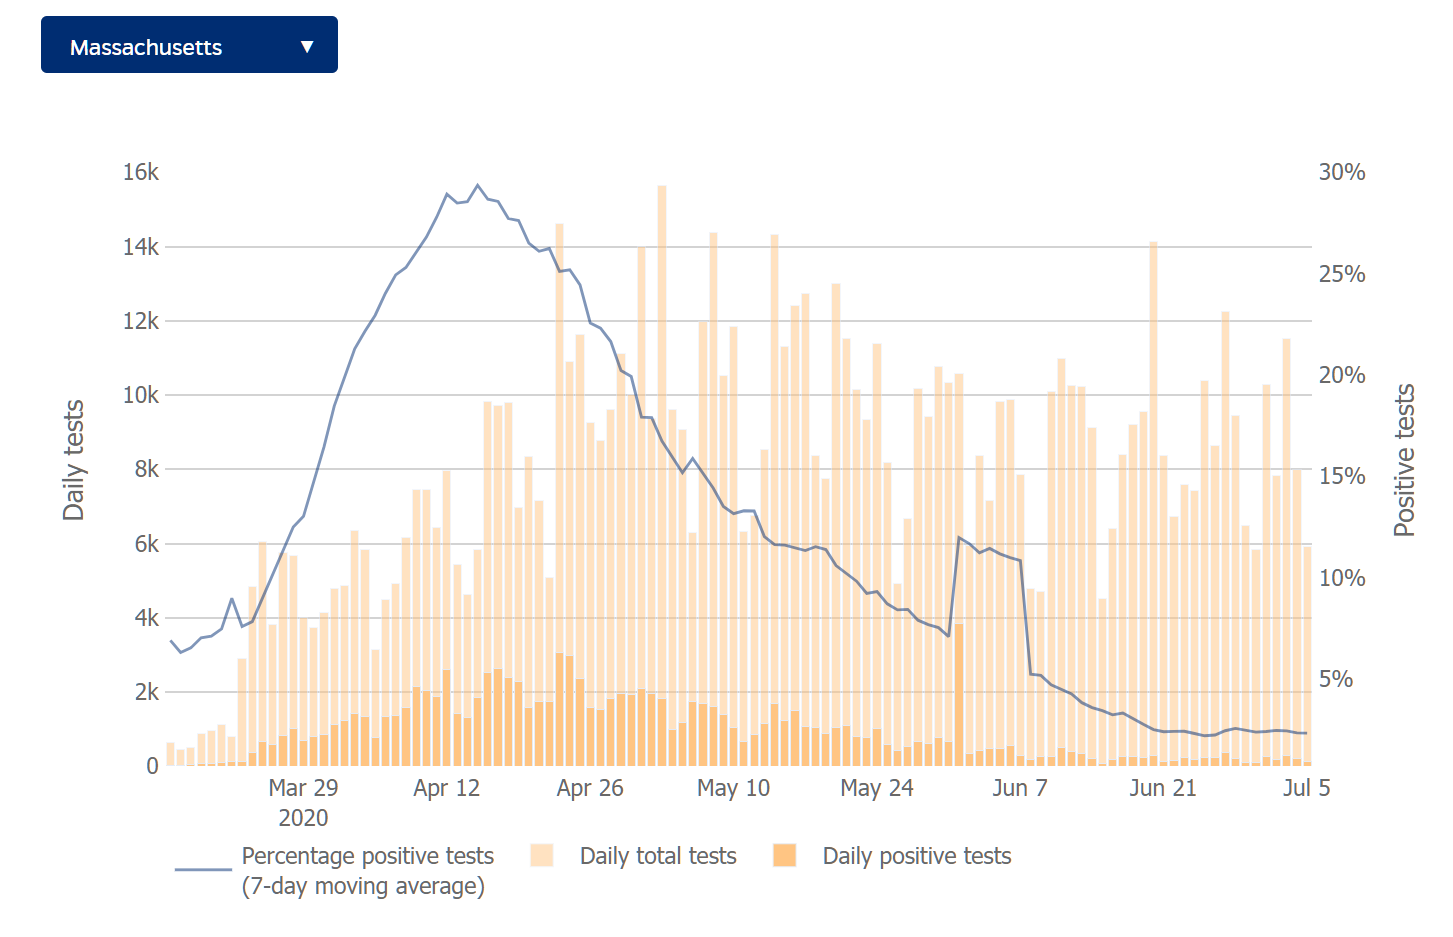
When you look at two members of the general public in a grocery store, none of the foregoing applies. Hospitals and doctors’ offices here in Maskachusetts seem to recognize this. If you need to enter one of these buildings you will be required to put your saliva-soaked face rag back into your pocket. Then you will be required to use hand sanitizer or soap and water. Then you will be given a brand-new clean paper face mask to wear. The bandana that protects society from the plague going exponential is not considered worthwhile protection inside the hospital.
Department of Sweden is still right (Karen Philip’s favorite department!): the Swedes give out free clean masks when people are getting on public transport.
Separately, if it as easy as the Mask Karens say to eliminate a virus by putting masks on the general population, why didn’t we use this technique to eliminate influenza, which has killed literally millions of Americans during my lifetime?
(What’s the downside of relying on masks? If we put our faith in masks and then, a few months down the road discover that they aren’t effective for the general population, that delays the measures that we actually need to take, e.g., moving more activities outdoors under shade structures, decluttering retail environments, having crowded high schools rent empty big box stores so that students can be spread out more.)
Bonus: allegorical photo showing the fate of those who don’t wear a mask, from the old fishing hamlet of Helgumannen. Faro, Gotland.

and another one… (Langhammars. Faro, Gotland)